

Question: This table summarizes several statistics for 36 monthly returns for American Electric Power (ticker AEP) and Microsoft (MSFT) over a three-year period. Obs Product (1)
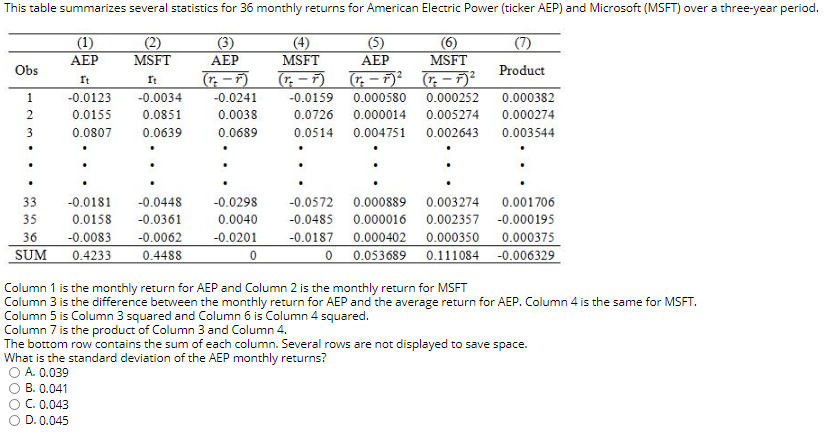
This table summarizes several statistics for 36 monthly returns for American Electric Power (ticker AEP) and Microsoft (MSFT) over a three-year period. Obs Product (1) It -0.0123 0.0155 0.0807 (2) MSFT It -0.0034 0.0851 0.0639 AEP (r:-) -0.0241 0.0038 0.0689 1 2 3 (5) (6) MSFT (r:- 1) (1.-7) 0.000580 0.000252 0.000014 0.005274 0.004751 0.002643 MSFT (r:-D) -0.0159 0.0726 0.0514 0.000382 0.000274 0.003544 . . 33 35 36 SUM -0.0181 0.0158 -0.0083 0.4233 -0.0448 -0.0361 -0.0062 0.4488 -0.0298 0.0040 -0.0201 0 -0.0572 0.000889 -0.0485 0.000016 -0.0187 0.000402 0 0.053689 0.003274 0.001706 0.002357 -0.000195 0.000350 0.000375 0.111084 -0.006329 Column 1 is the monthly return for AEP and Column 2 is the monthly return for MSFT Column 3 is the difference between the monthly return for AEP and the average return for AEP. Column 4 is the same for MSFT. Column 5 is Column 3 squared and Column 6 is Column 4 squared. Column 7 is the product of Column 3 and Column 4. The bottom row contains the sum of each column. Several rows are not displayed to save space. What is the standard deviation of the AEP monthly returns? A. 0.039 B. 0.041 C. 0.043 D. 0.045
Step by Step Solution
There are 3 Steps involved in it

Get step-by-step solutions from verified subject matter experts