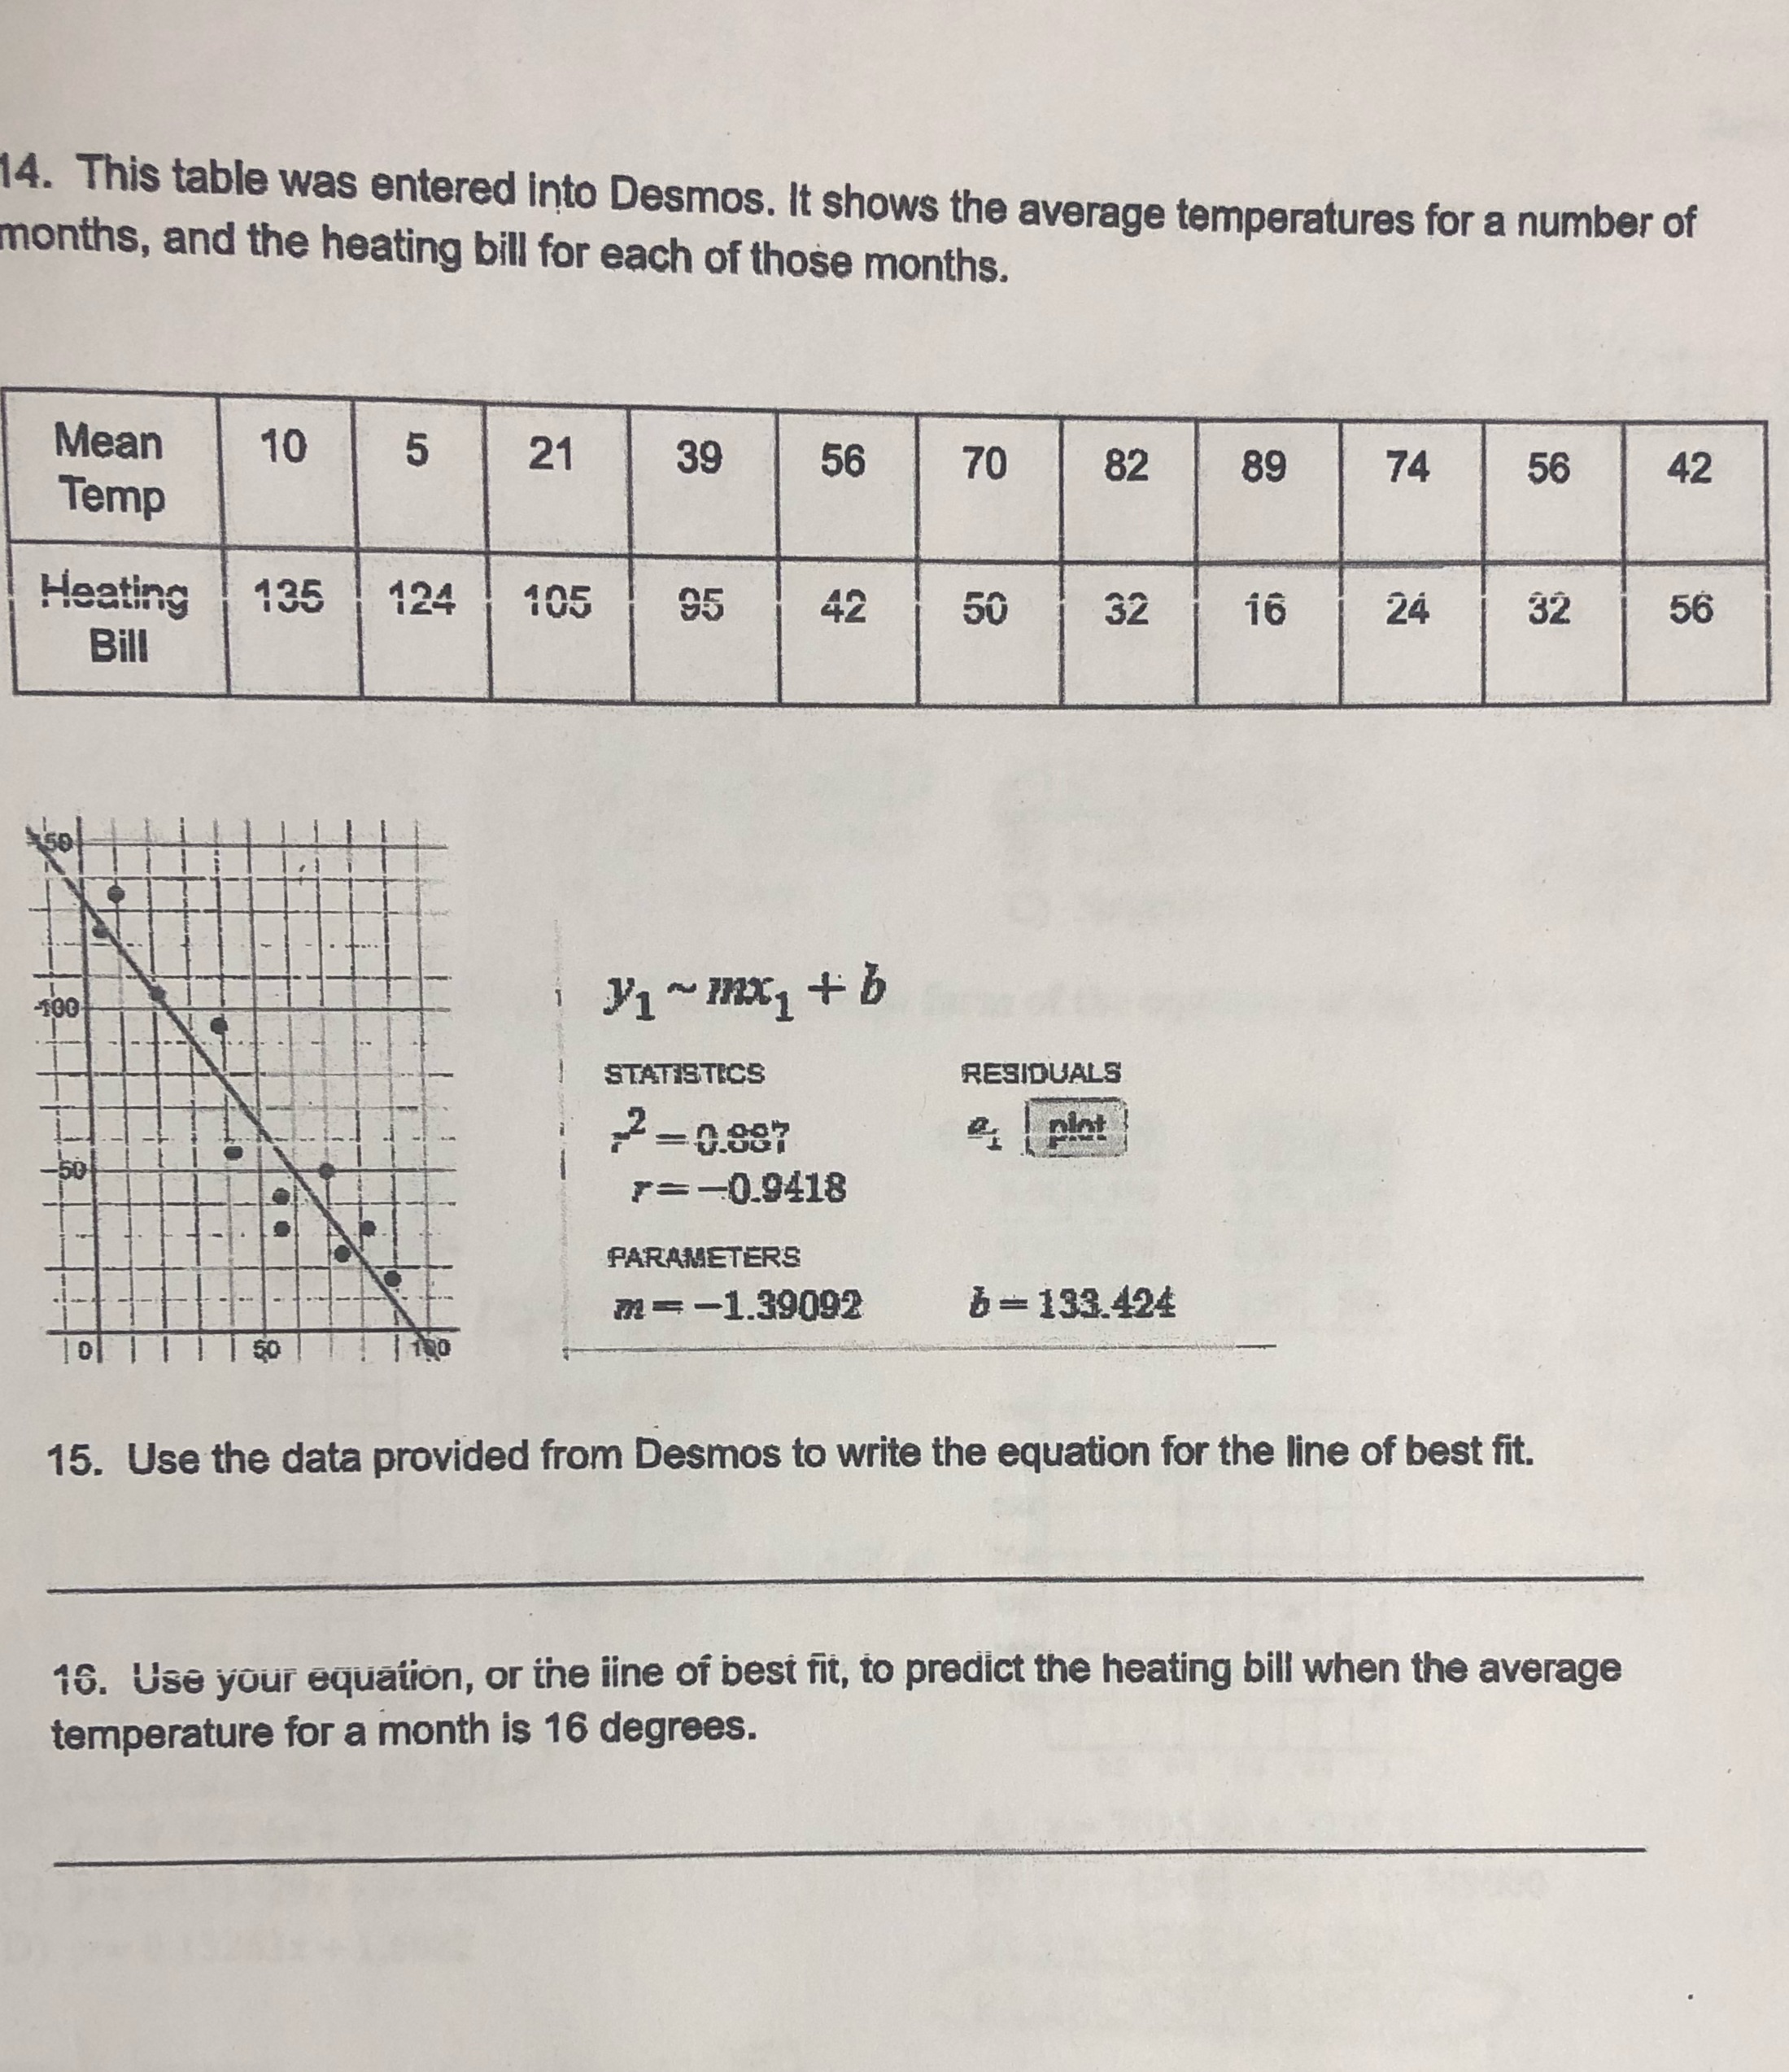
Question: This table was entered into Desmos. It shows the average temperatures for a number of months, and the heating bill for each of those months.

This table was entered into Desmos. It shows the average temperatures for a number of months, and the heating bill for each of those months. *see image and questions

This table was entered into Desmos. It shows the
14. This table was entered into Desmos. It shows the average temperatures for a number of months, and the heating bill for each of those months. Mean 10 5 21 39 56 70 82 89 74 56 42 Temp Heating 135 124 105 95 42 50 32 16 24 32 56 Bill V1 ~ mx +b STATISTICS RESIDUALS =0.887 7=-0.9418 PARAMETERS m =-1.39092 b = 133.424 15. Use the data provided from Desmos to write the equation for the line of best fit. 16. Use your equation, or the line of best fit, to predict the heating bill when the average temperature for a month is 16 degrees

Step by Step Solution

There are 3 Steps involved in it

1 Expert Approved Answer
Step: 1 Unlock blur-text-image
Question Has Been Solved by an Expert!

Get step-by-step solutions from verified subject matter experts

Step: 2 Unlock
Step: 3 Unlock

Students Have Also Explored These Related Mathematics Questions!