

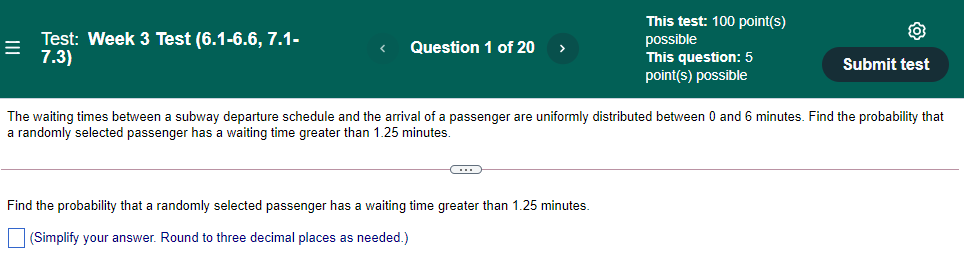
Question: This test: 100 pointts) . possible 7.3] Ques'bon 3 01:20 111is question: 5 pointijsj} possible e Submit test Test: Week 3 Test (6.1-6.6, ?.1- The
![This test: 100 pointts) . possible 7.3] Ques'bon 3 01:20 111is](https://s3.amazonaws.com/si.experts.images/answers/2024/07/6686f5153d6bf_5976686f5151cdcb.jpg)
This test: 100 pointts) . possible 7.3] Ques'bon 3 01:20 111is question: 5 pointijsj} possible e Submit test Test: Week 3 Test (6.1-6.6, ?.1- The ages of a group of 14? randomly selected adult females have a standard deviation of 18.5 years. Assume that the ages of female statistics students have less variation than ages of females in the general population, so let 0' = 18.5 years for the sample size calculation. How many female statistics student ages must be obtained in order to estimate the mean age of all female statistics students? Assume that we want 95% condence that the sample mean is within onehalf year ofthe population mean. Does it seem reasonable to assume that the ages of female statistics students have less variation than ages of females in the general population? The required sample size is El. (Round up to the nearest whole number as needed.) Does it seem reasonable to assume that the ages of female statistics students have less variation than ages of females in the general population? 0 A. No, because statistics students are typically older than people in the general population. 0 B. No. because there is no age difference between the population of statistics students and the general population. 0 C. Yes, because statistics students are typically older than people in the general population. 0 D. Yes, because statistics students are typically younger than people in the general population. This test: 100 point(s) E Test: Week 3 Test (6.1-6.6, 7.1- Question 1 of 20 possible 7.3)
Step by Step Solution
There are 3 Steps involved in it

Get step-by-step solutions from verified subject matter experts