

Question: This test: 20 point(s) E Test: Exam #1 Test: Exam #1 Question 7 of 20 This test: 20 point(s) possible This question: 1 point(s) possible


This test: 20 point(s) E Test: Exam #1
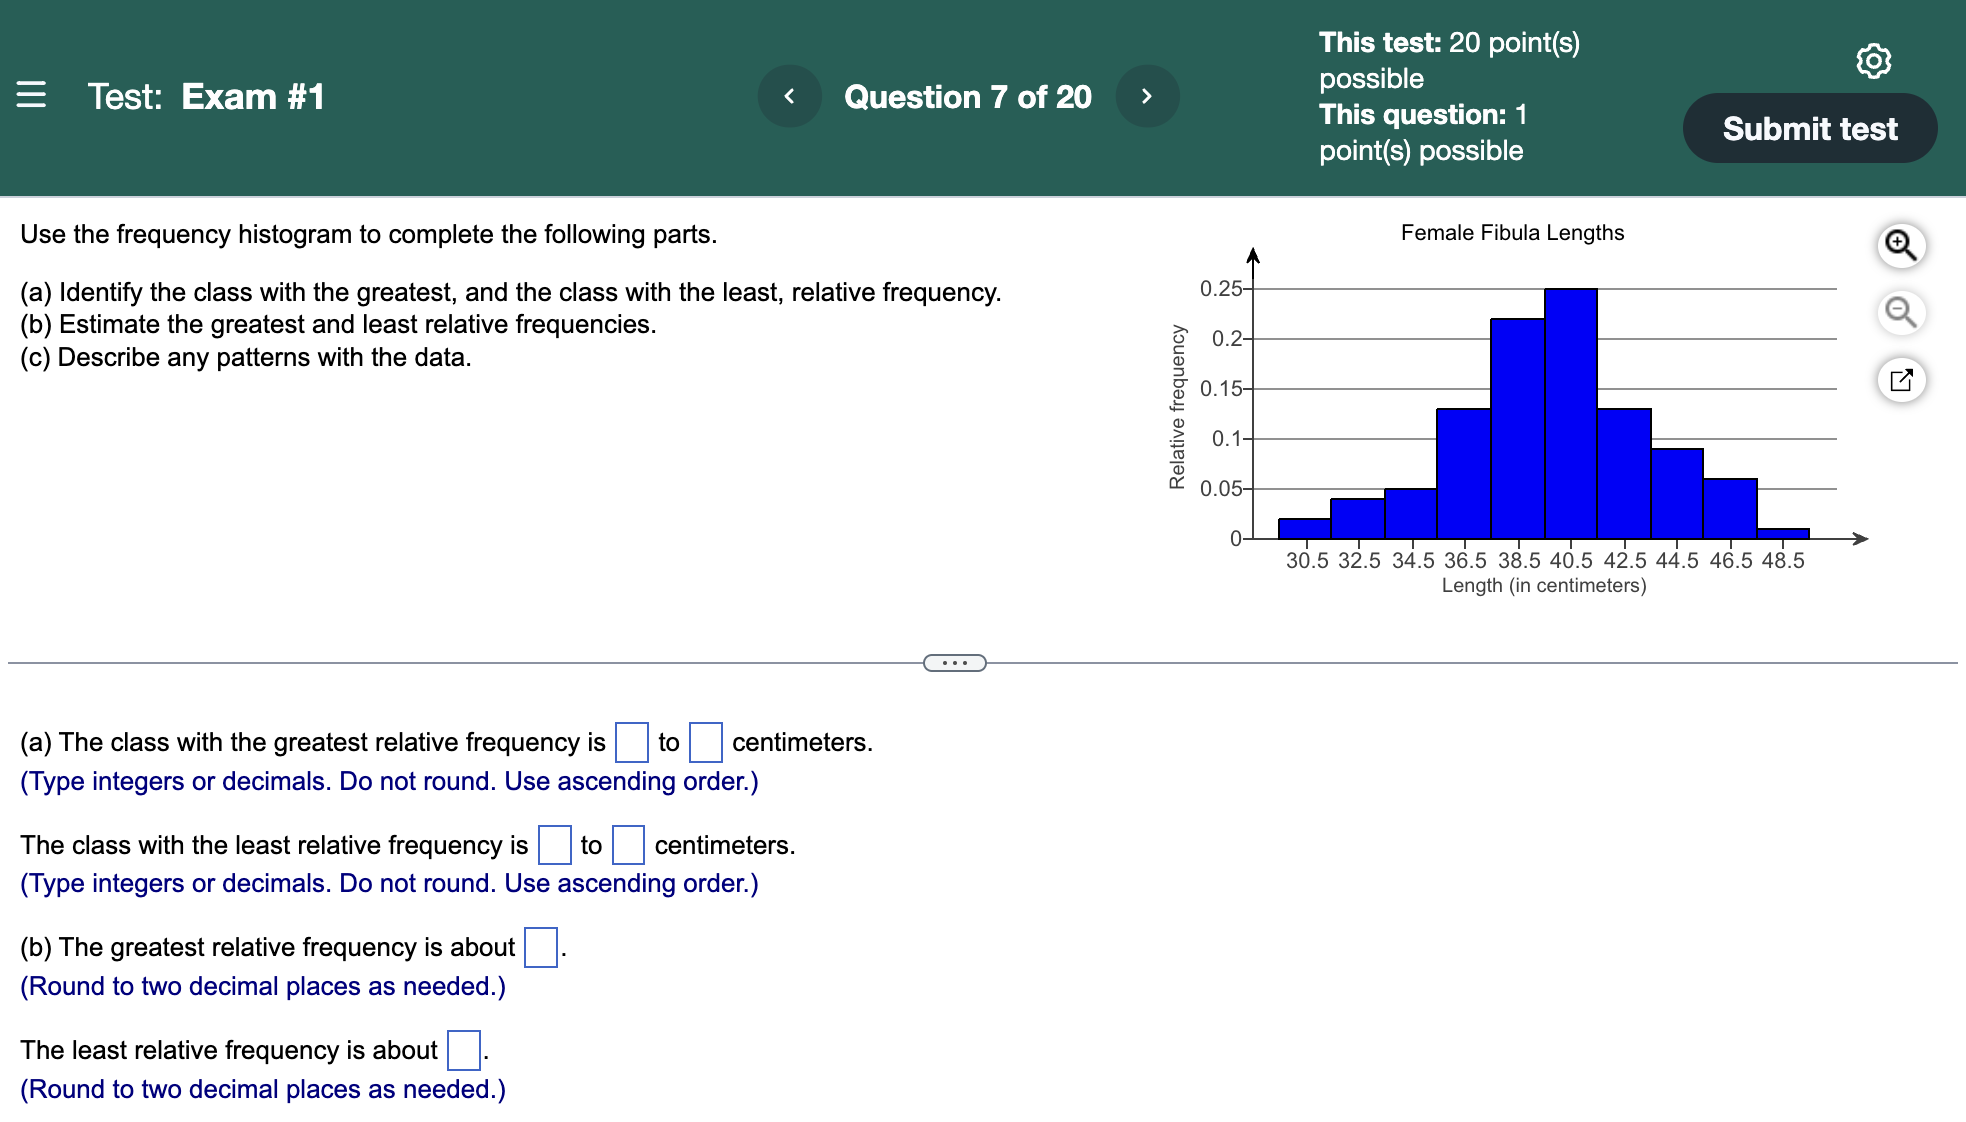
Test: Exam #1 Question 7 of 20 This test: 20 point(s) possible This question: 1 point(s) possible Female Fibula Lengths 0.25 0.2 8 0.15 0.1 0.05 Submit test Use the frequency histogram to complete the following parts. (a) Identify the class with the greatest, and the class with the least, relative frequency. (b) Estimate the greatest and least relative frequencies. (c) Describe any patterns with the data. (a) The class with the greatest relative frequency is centimeters. (Type integers or decimals. Do not round. Use ascending order.) The class with the least relative frequency is centimeters. (Type integers or decimals. Do not round. Use ascending order.) (b) The greatest relative frequency is about (Round to two decimal places as needed.) The least relative frequency is about (Round to two decimal places as needed.) 30.5 32.5 34.5 36.5 38.5 40.5 42.5 44.5 46.5 48.5 Length (in centimeters)
Step by Step Solution
There are 3 Steps involved in it

Get step-by-step solutions from verified subject matter experts