

Question: This test: 52 point(s) Test: Test 7 Question 1 of 16 possible This question: 4 point(s) possible Use the value of the linear correlation coefficient


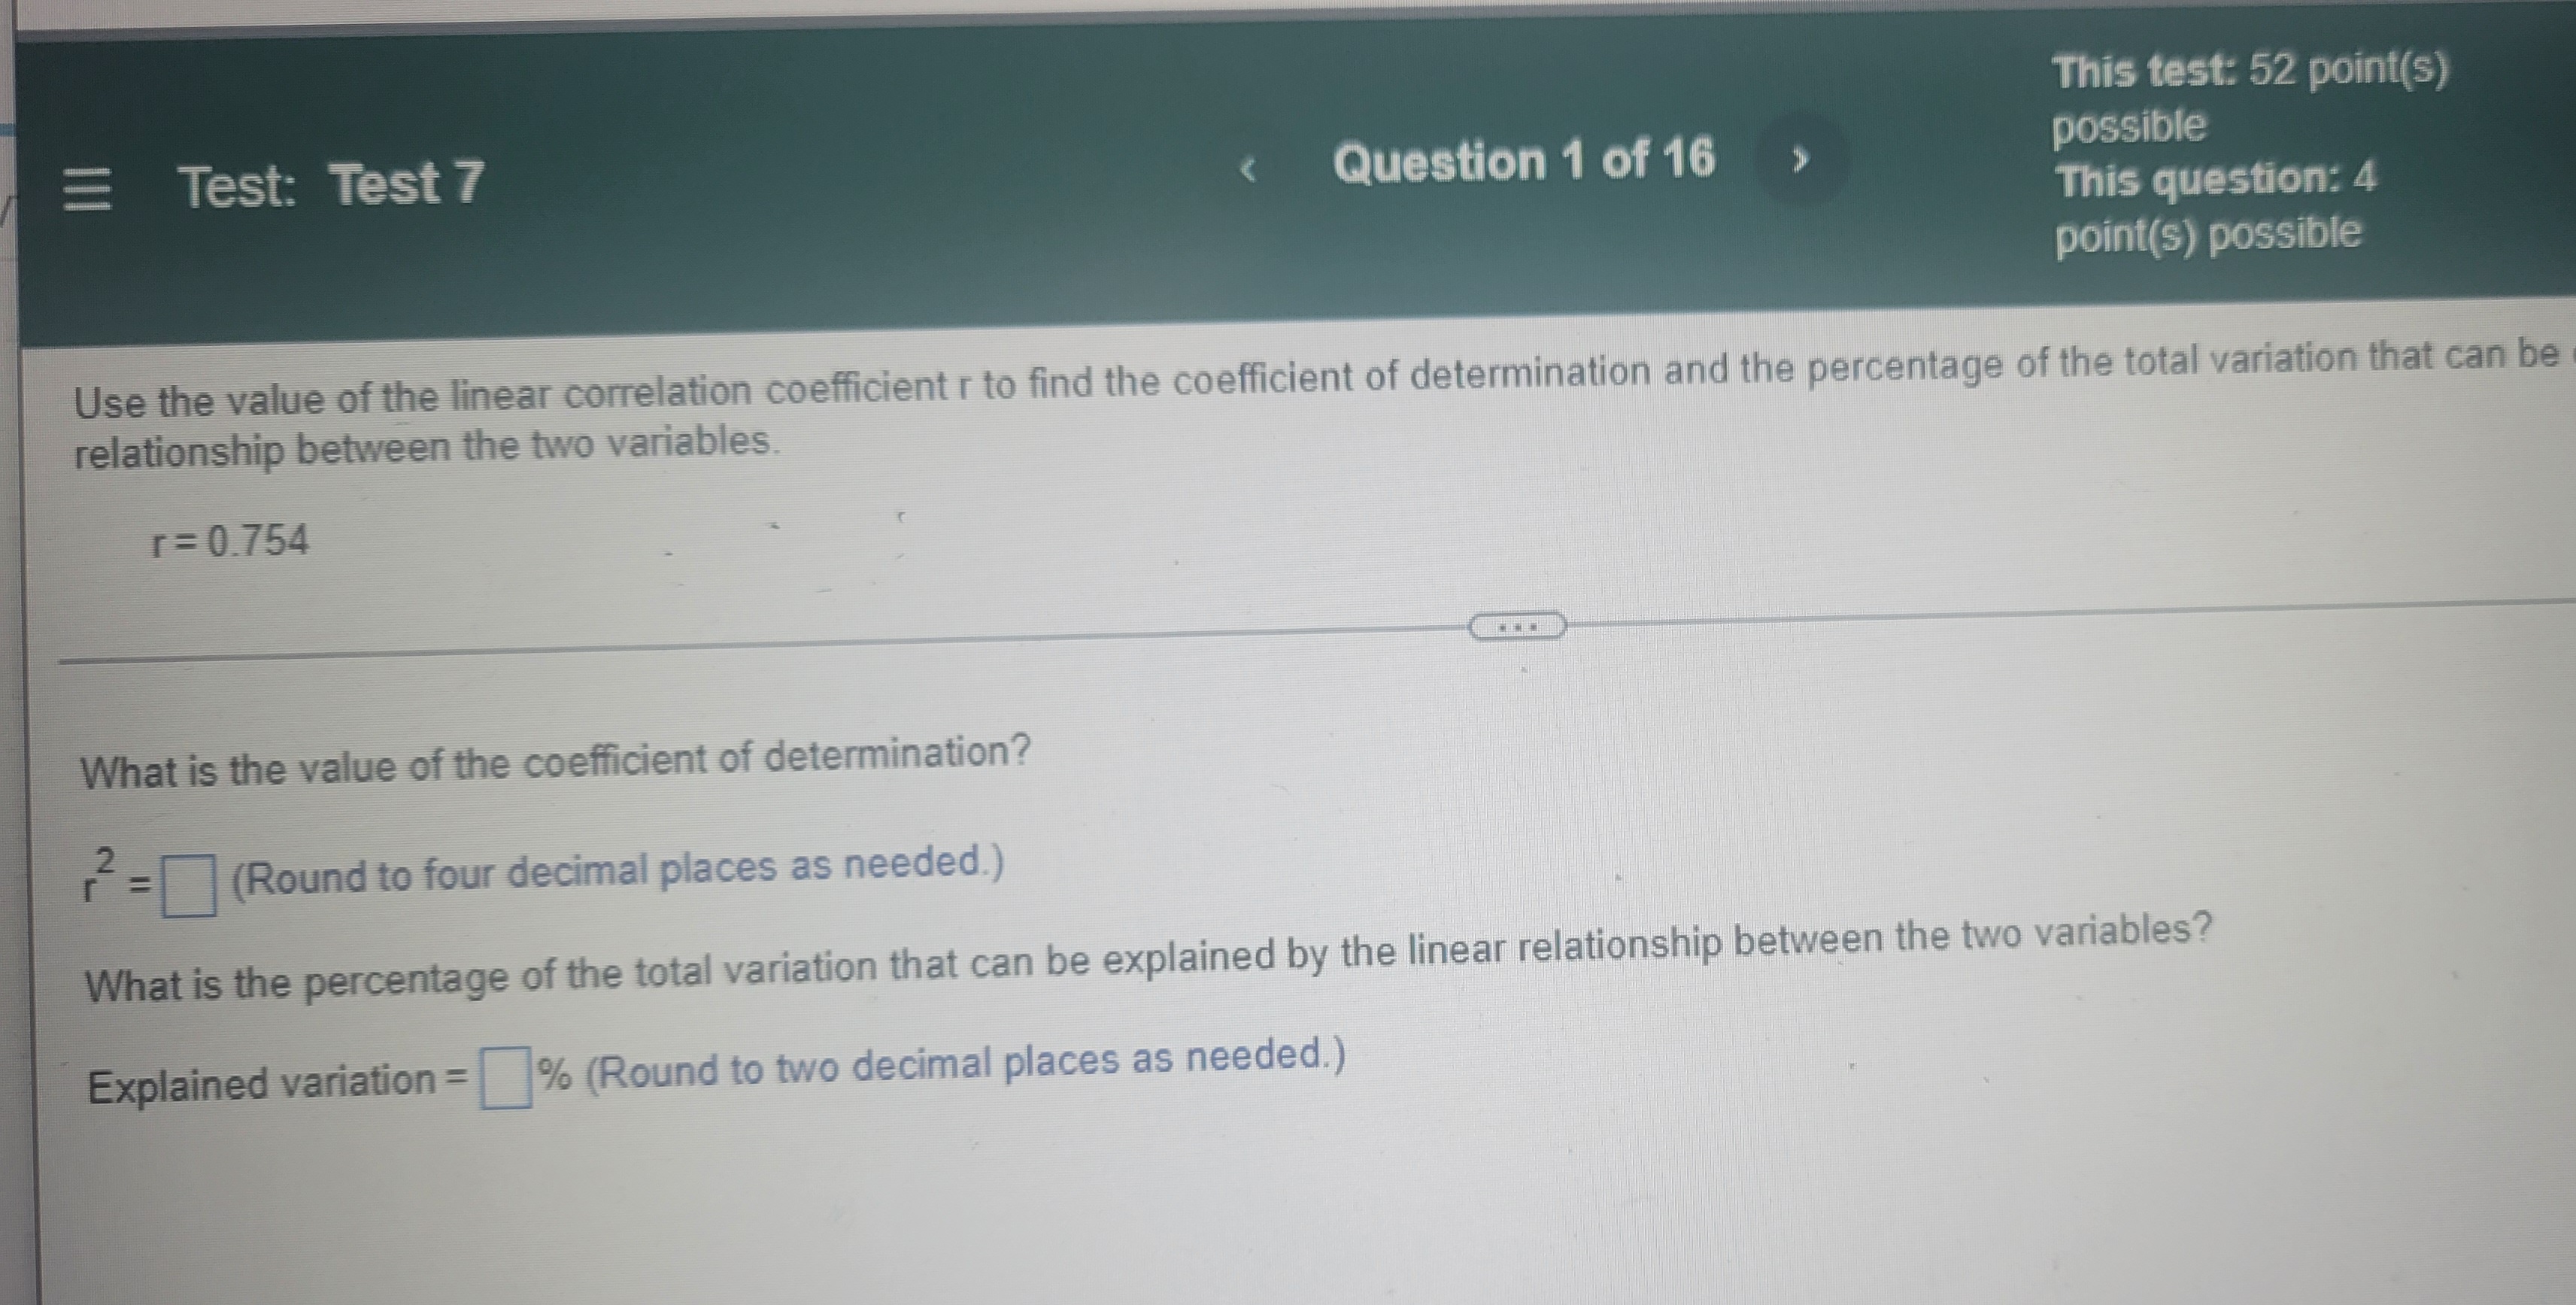

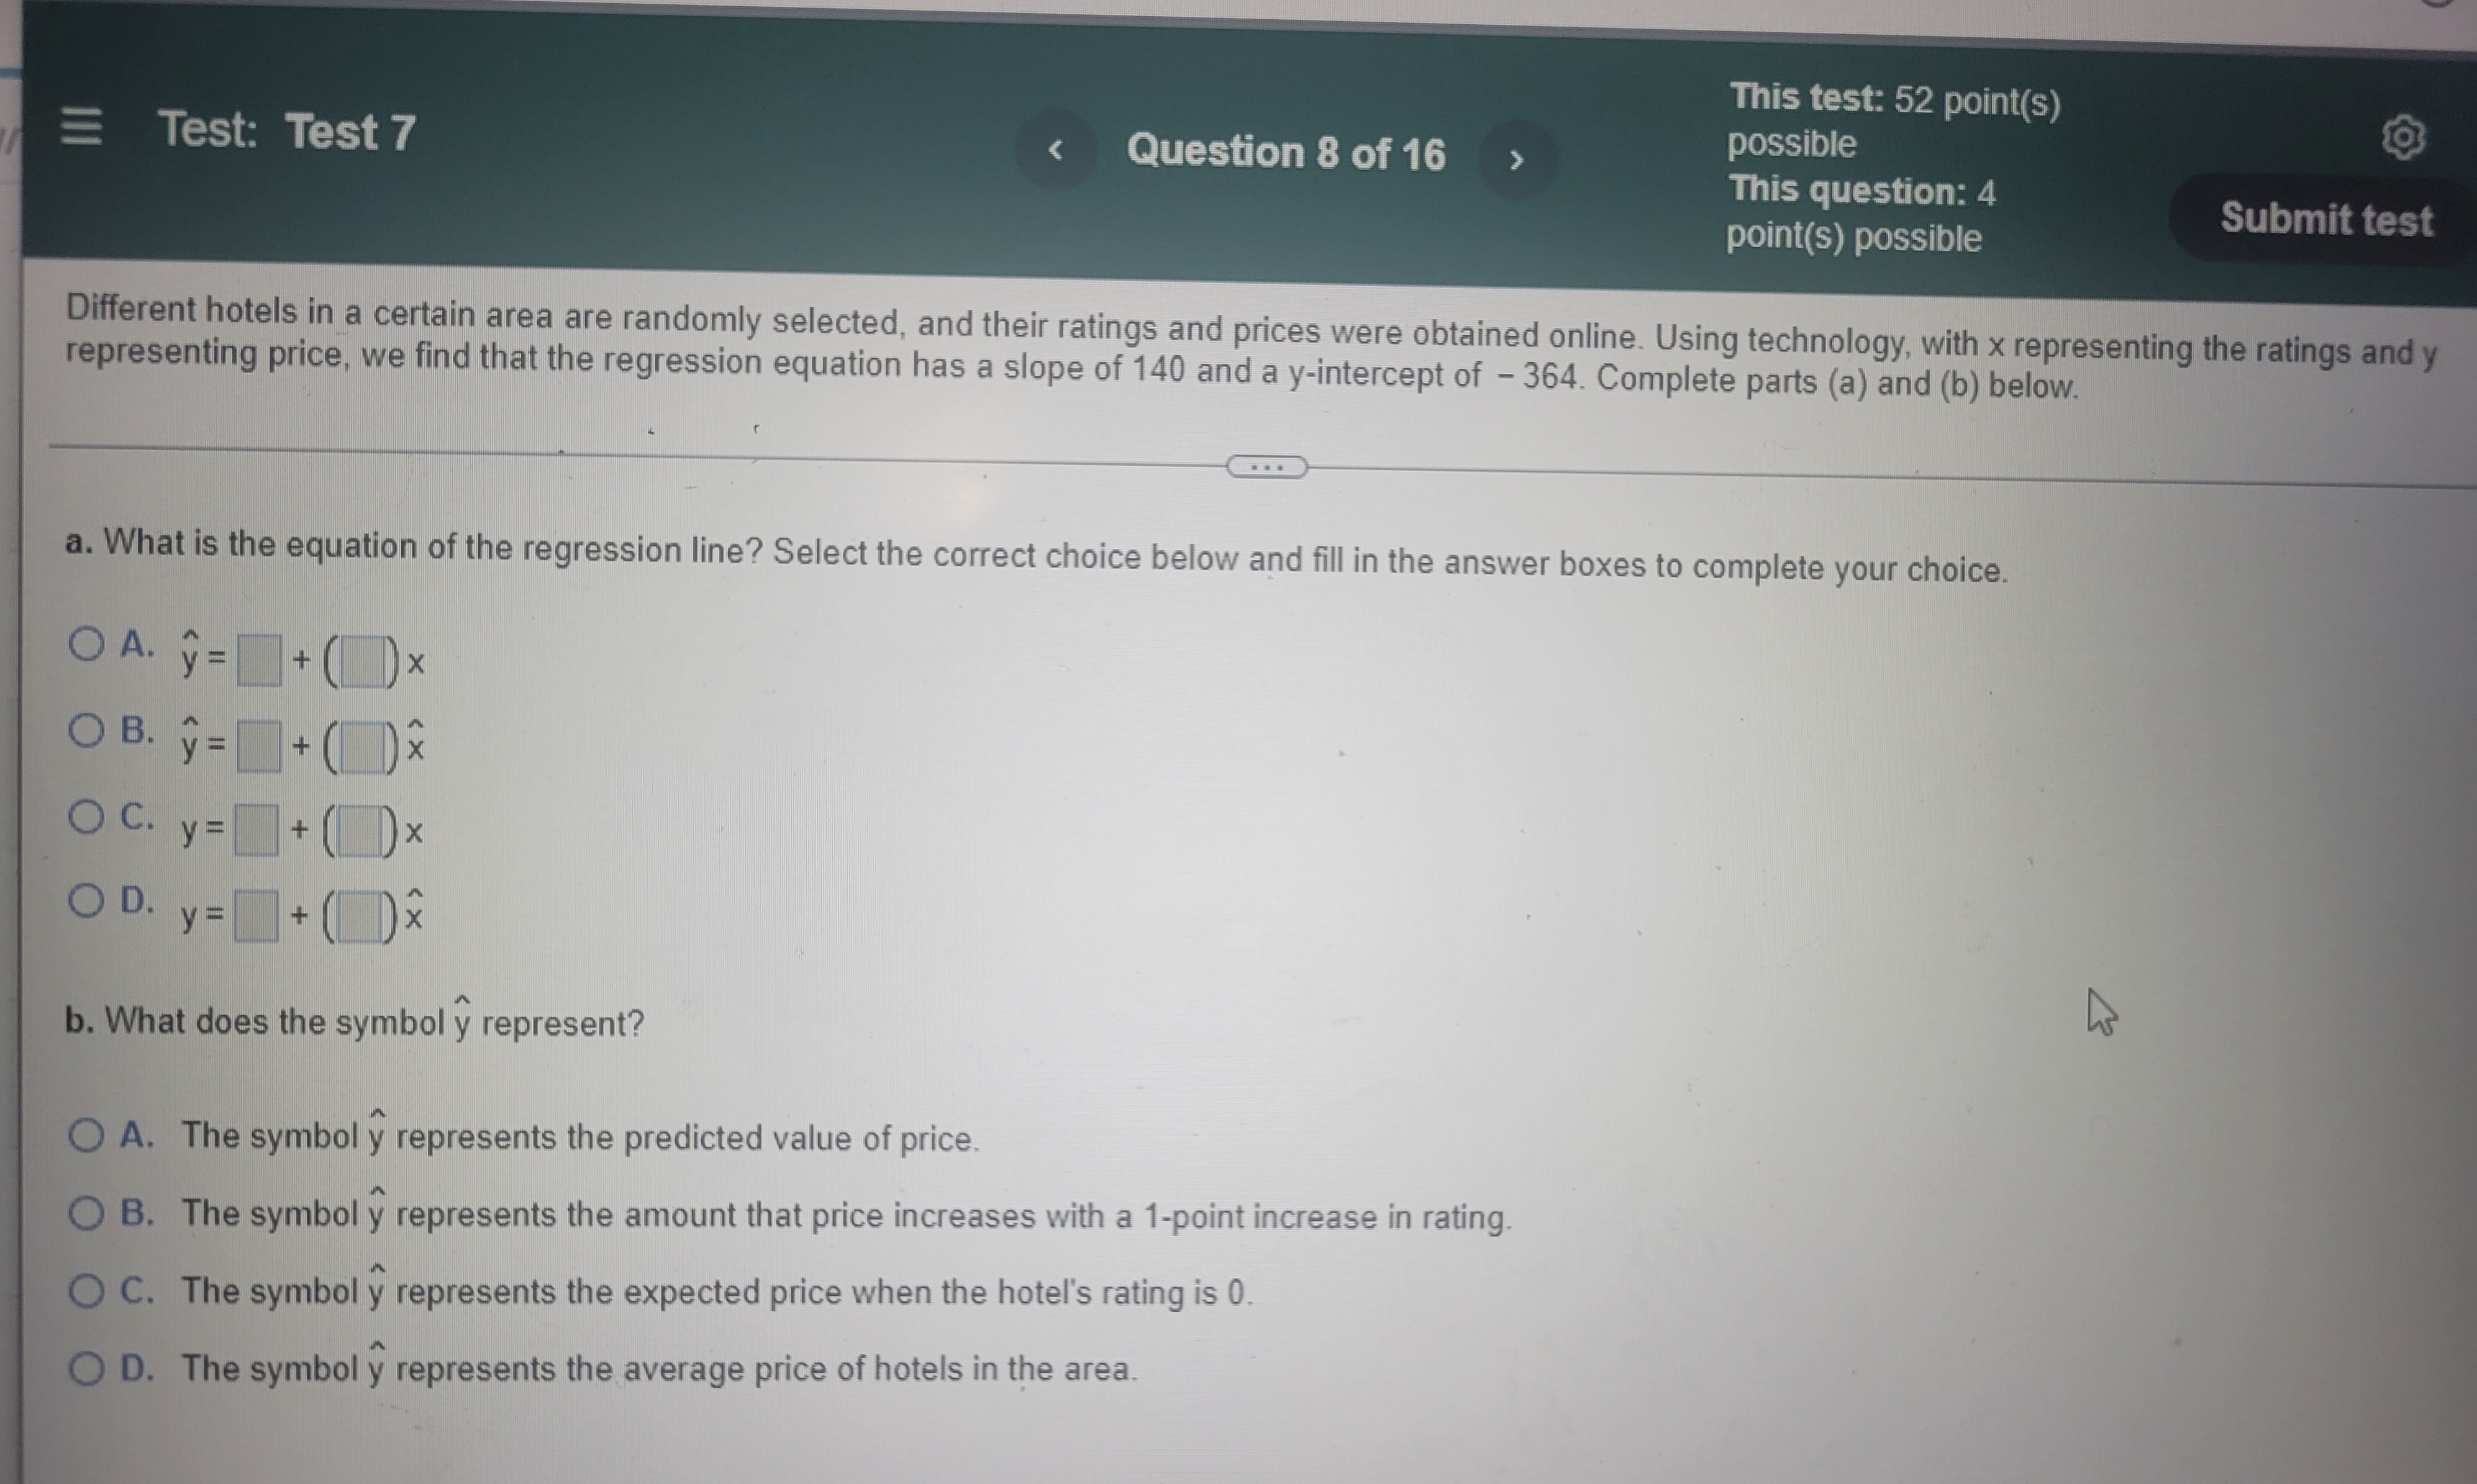

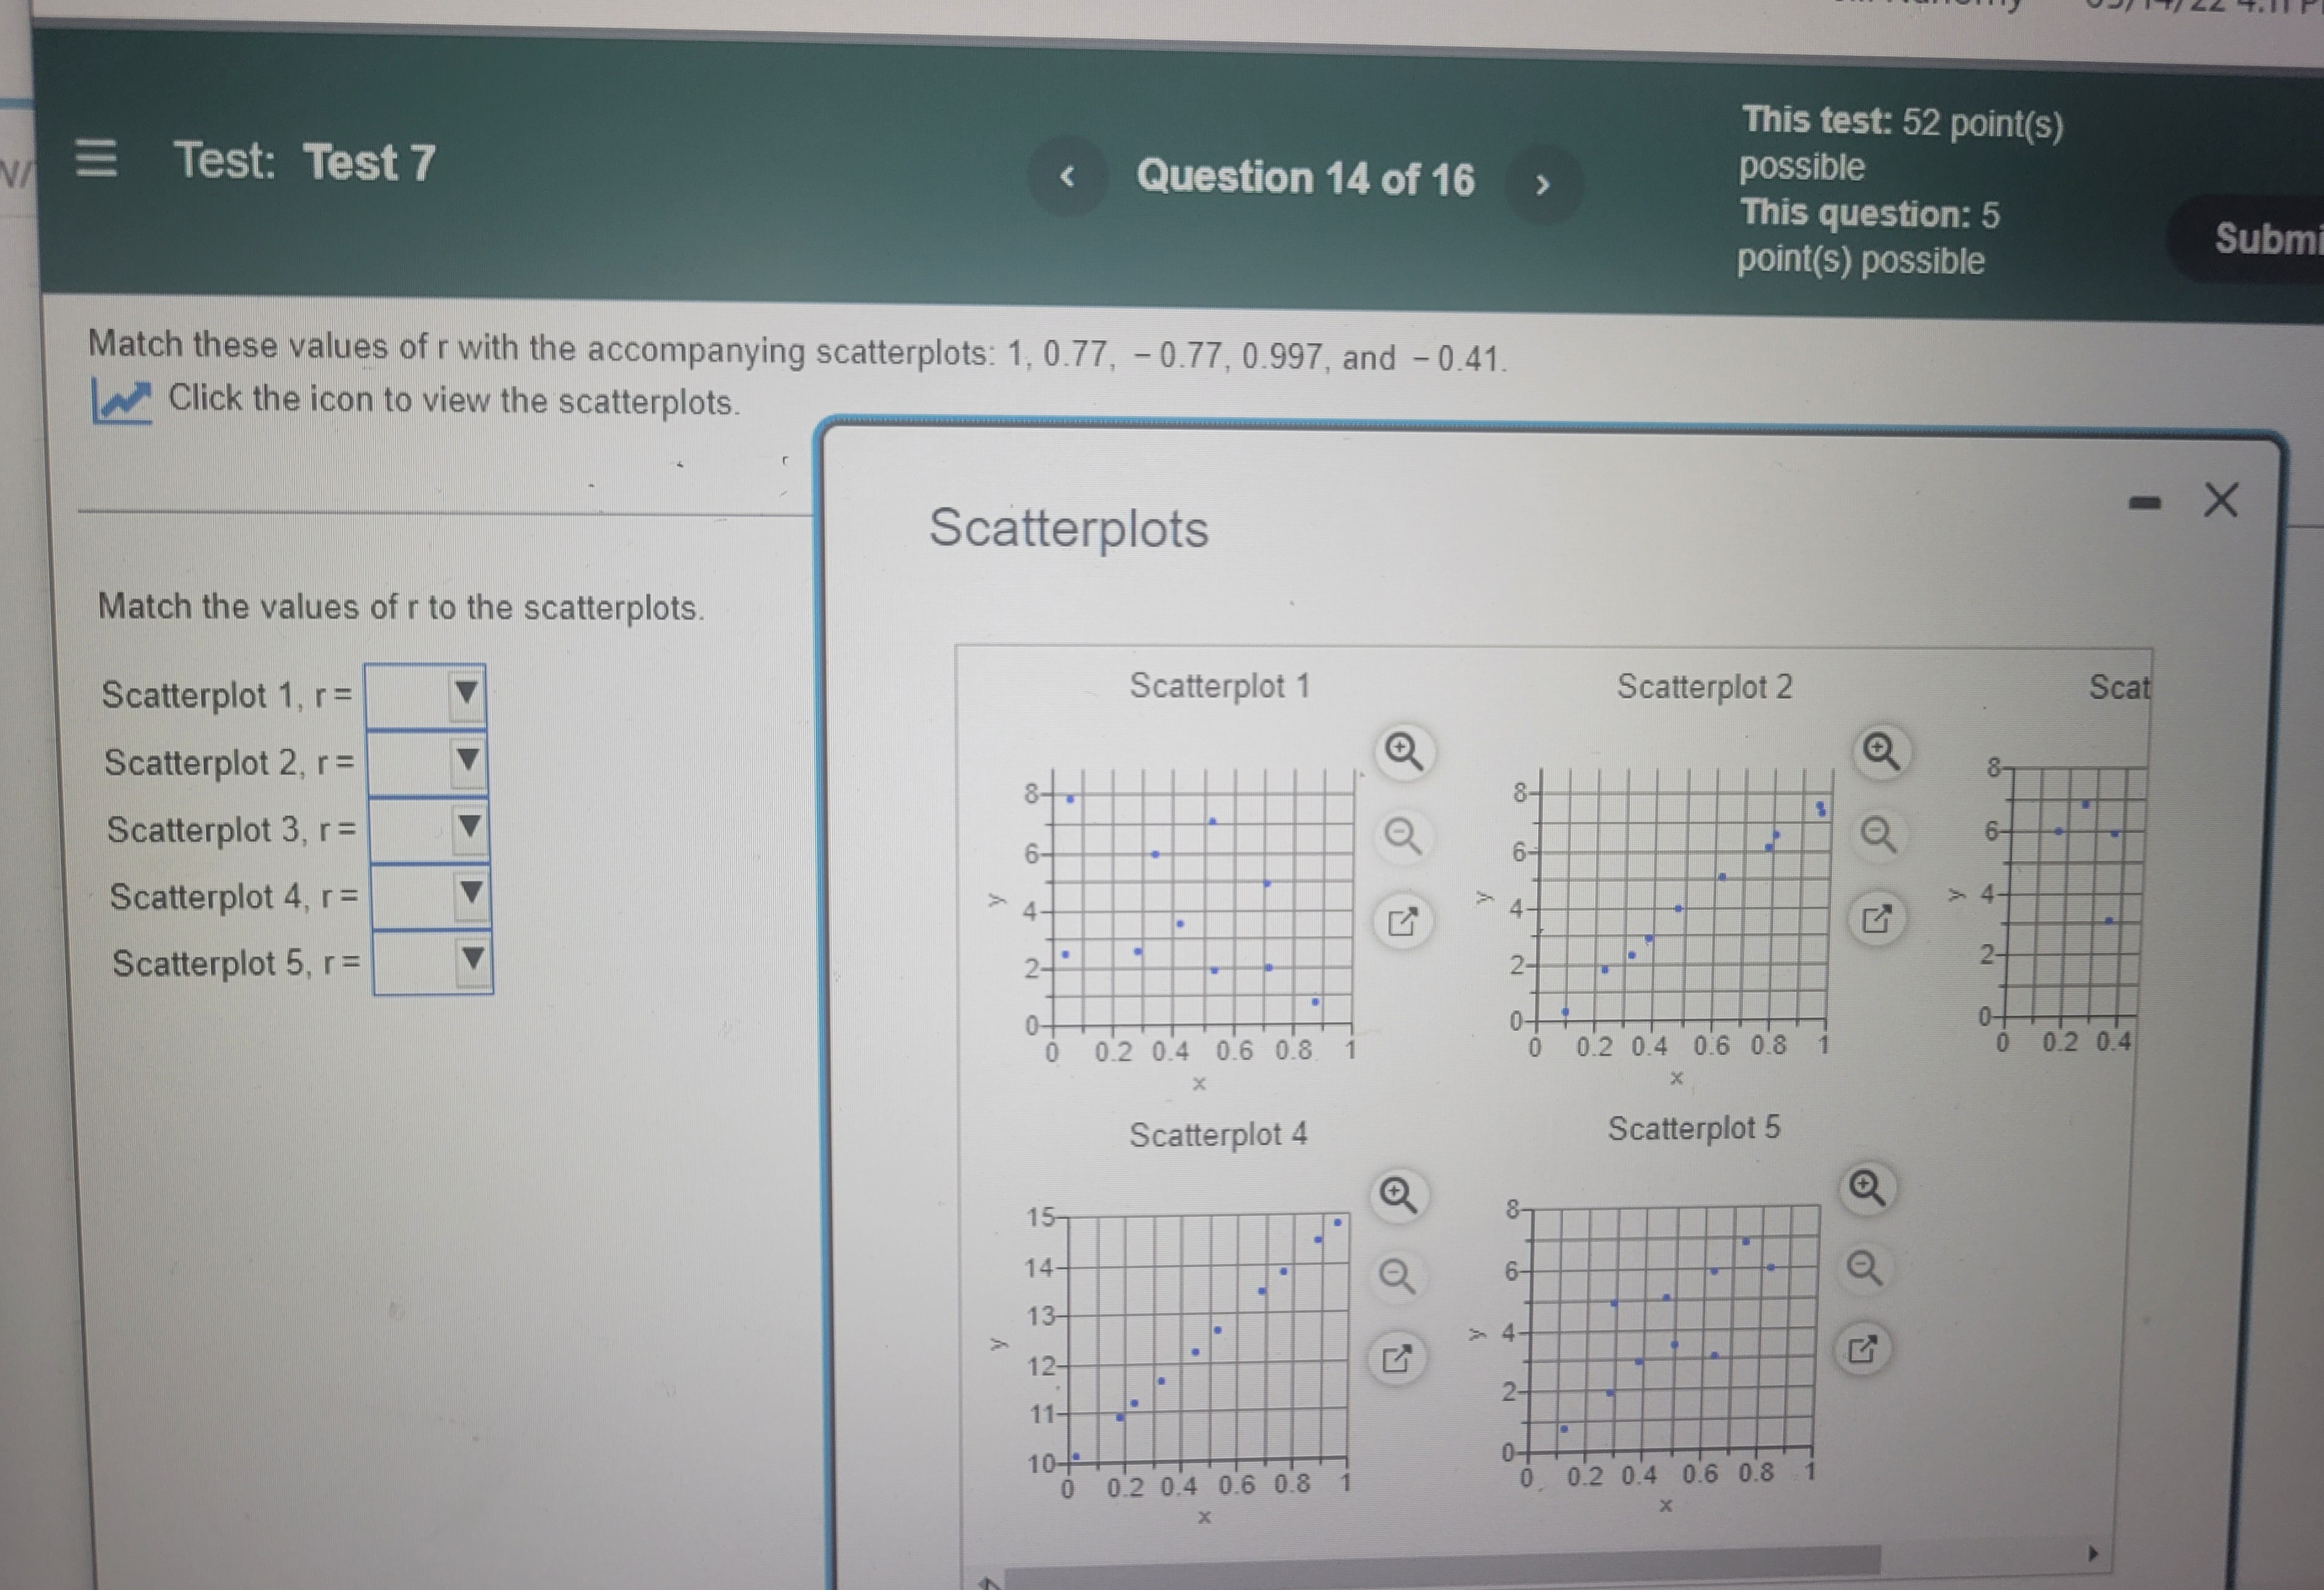
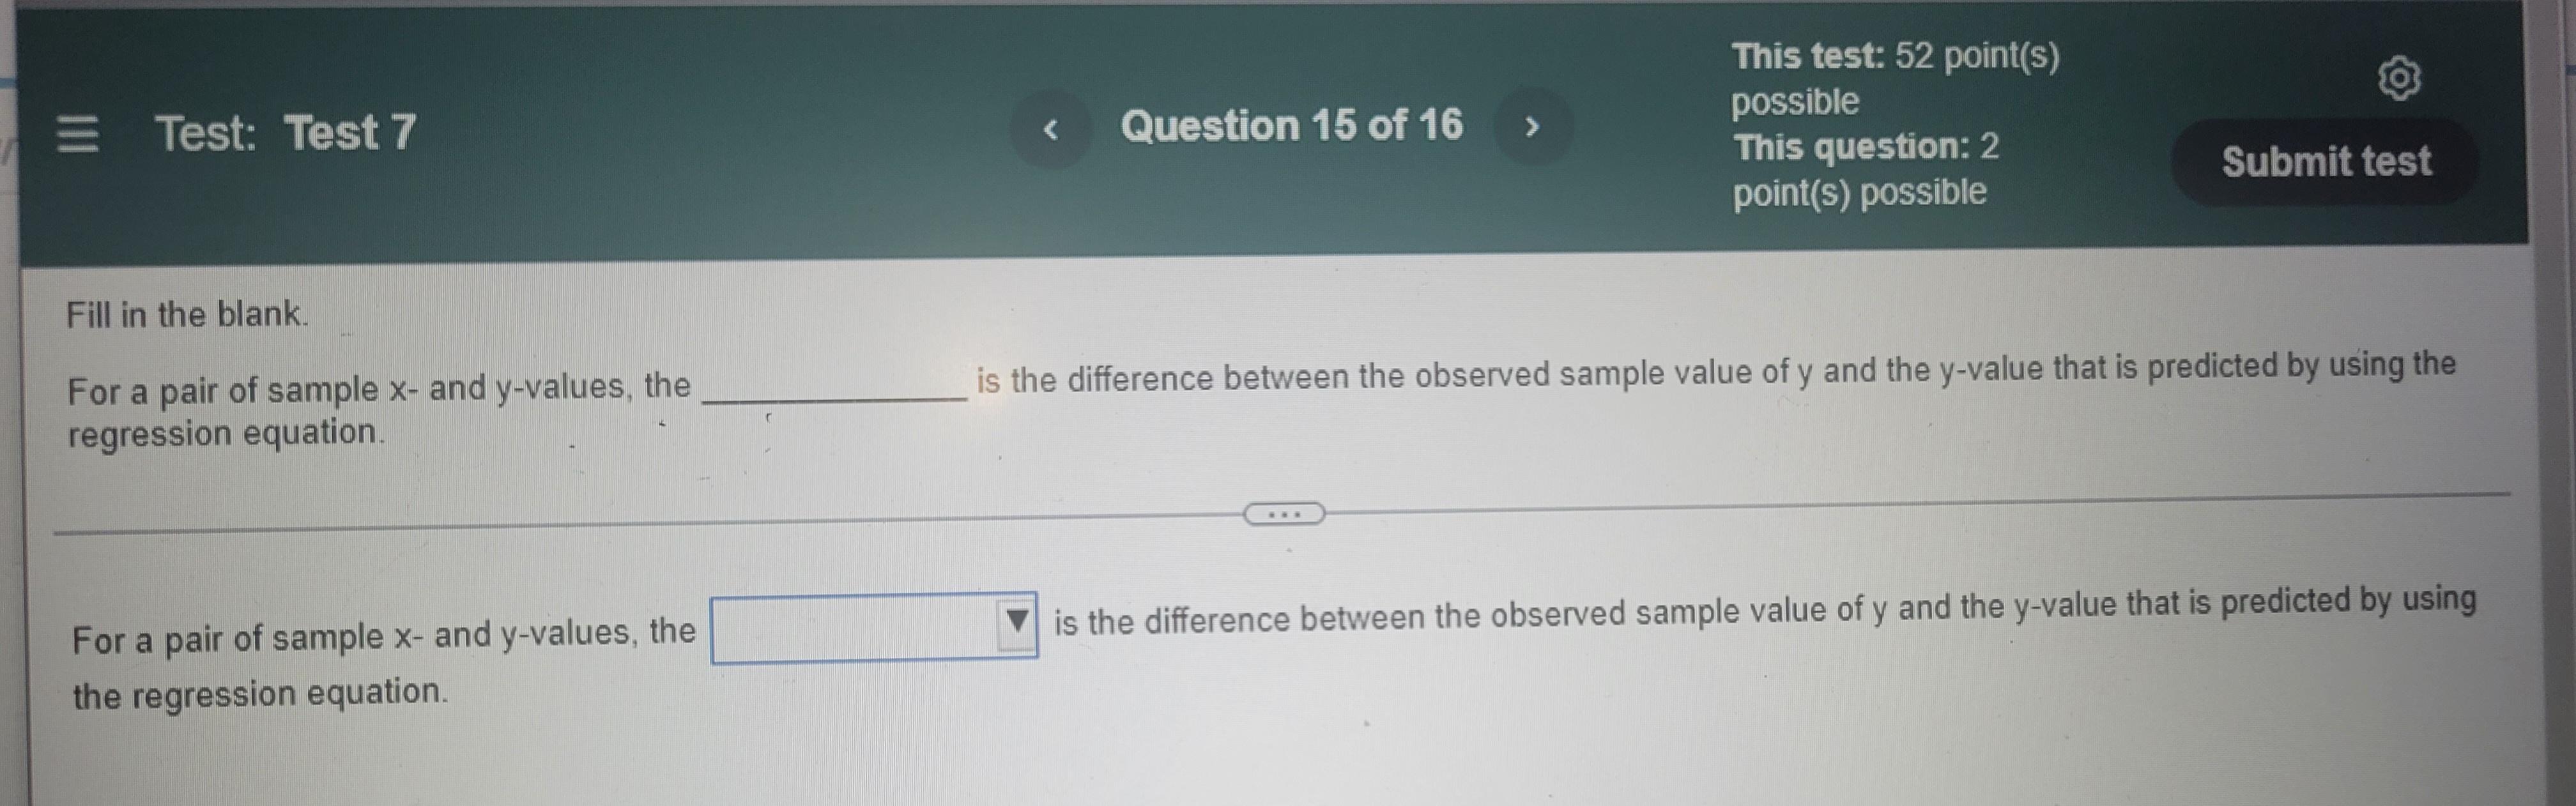

This test: 52 point(s) Test: Test 7 Question 1 of 16 possible This question: 4 point(s) possible Use the value of the linear correlation coefficient r to find the coefficient of determination and the percentage of the total variation that can be relationship between the two variables. r = 0.754 What is the value of the coefficient of determination? =(Round to four decimal places as needed.) What is the percentage of the total variation that can be explained by the linear relationship between the two variables? Explained variation = % (Round to two decimal places as needed.)Test: Test 7 Determine if the statement below is true or false If you find any outliers or high leverage points in your data, you should delete them from the analysis. The statement isThis test: 52 point(s) E Test: Test 7 possible This question: 5 point(s) possible Subm Match these values of r with the accompanying scatterplots: 1, 0.77, - 0.77, 0.997, and - 0.41. L Click the icon to view the scatterplots. Scatterplots - X Match the values of r to the scatterplots. Scatterplot 1, r = Scatterplot 1 Scatterplot 2 Scat Scatterplot 2, r = Scatterplot 3, r = Scatterplot 4, r = 4+ Scatterplot 5, r = J . 2- 0 0.2 0.4 0.6 0.8. 0.2 0.4 0.6 0.8 0.2 0.4 Scatterplot 4 Scatterplot 5 15 14- 13- 12- 11- 10- 0 0.2 0.4 0.6 0.8 0.2 0.4 0.6 0.8 1This test: 52 point(s) = Test: Test 7 possible This question: 2 point(s) possible Submit test Fill in the blank. For a pair of sample x- and y-values, the is the difference between the observed sample value of y and the y-value that is predicted by using the regression equation. For a pair of sample x- and y-values, the is the difference between the observed sample value of y and the y-value that is predicted by using the regression equation.This test: 52 point(s) E Test: Test 7 Question 16 of 16 possible This question: 2 Su point(s) possible Fill in the blank. If our data in a scatterplot is "straight enough" we can model our data with a If our data in a scatterplot is "straight enough" we can model our data with a
Step by Step Solution
There are 3 Steps involved in it

Get step-by-step solutions from verified subject matter experts