

Question: This test: 70 point(s) possible Test: Test 2 = Test: Test2 Question 11 of 34 This test: 70 point(s) possible This question: 2 point(s) possible


This test: 70 point(s) possible Test: Test 2
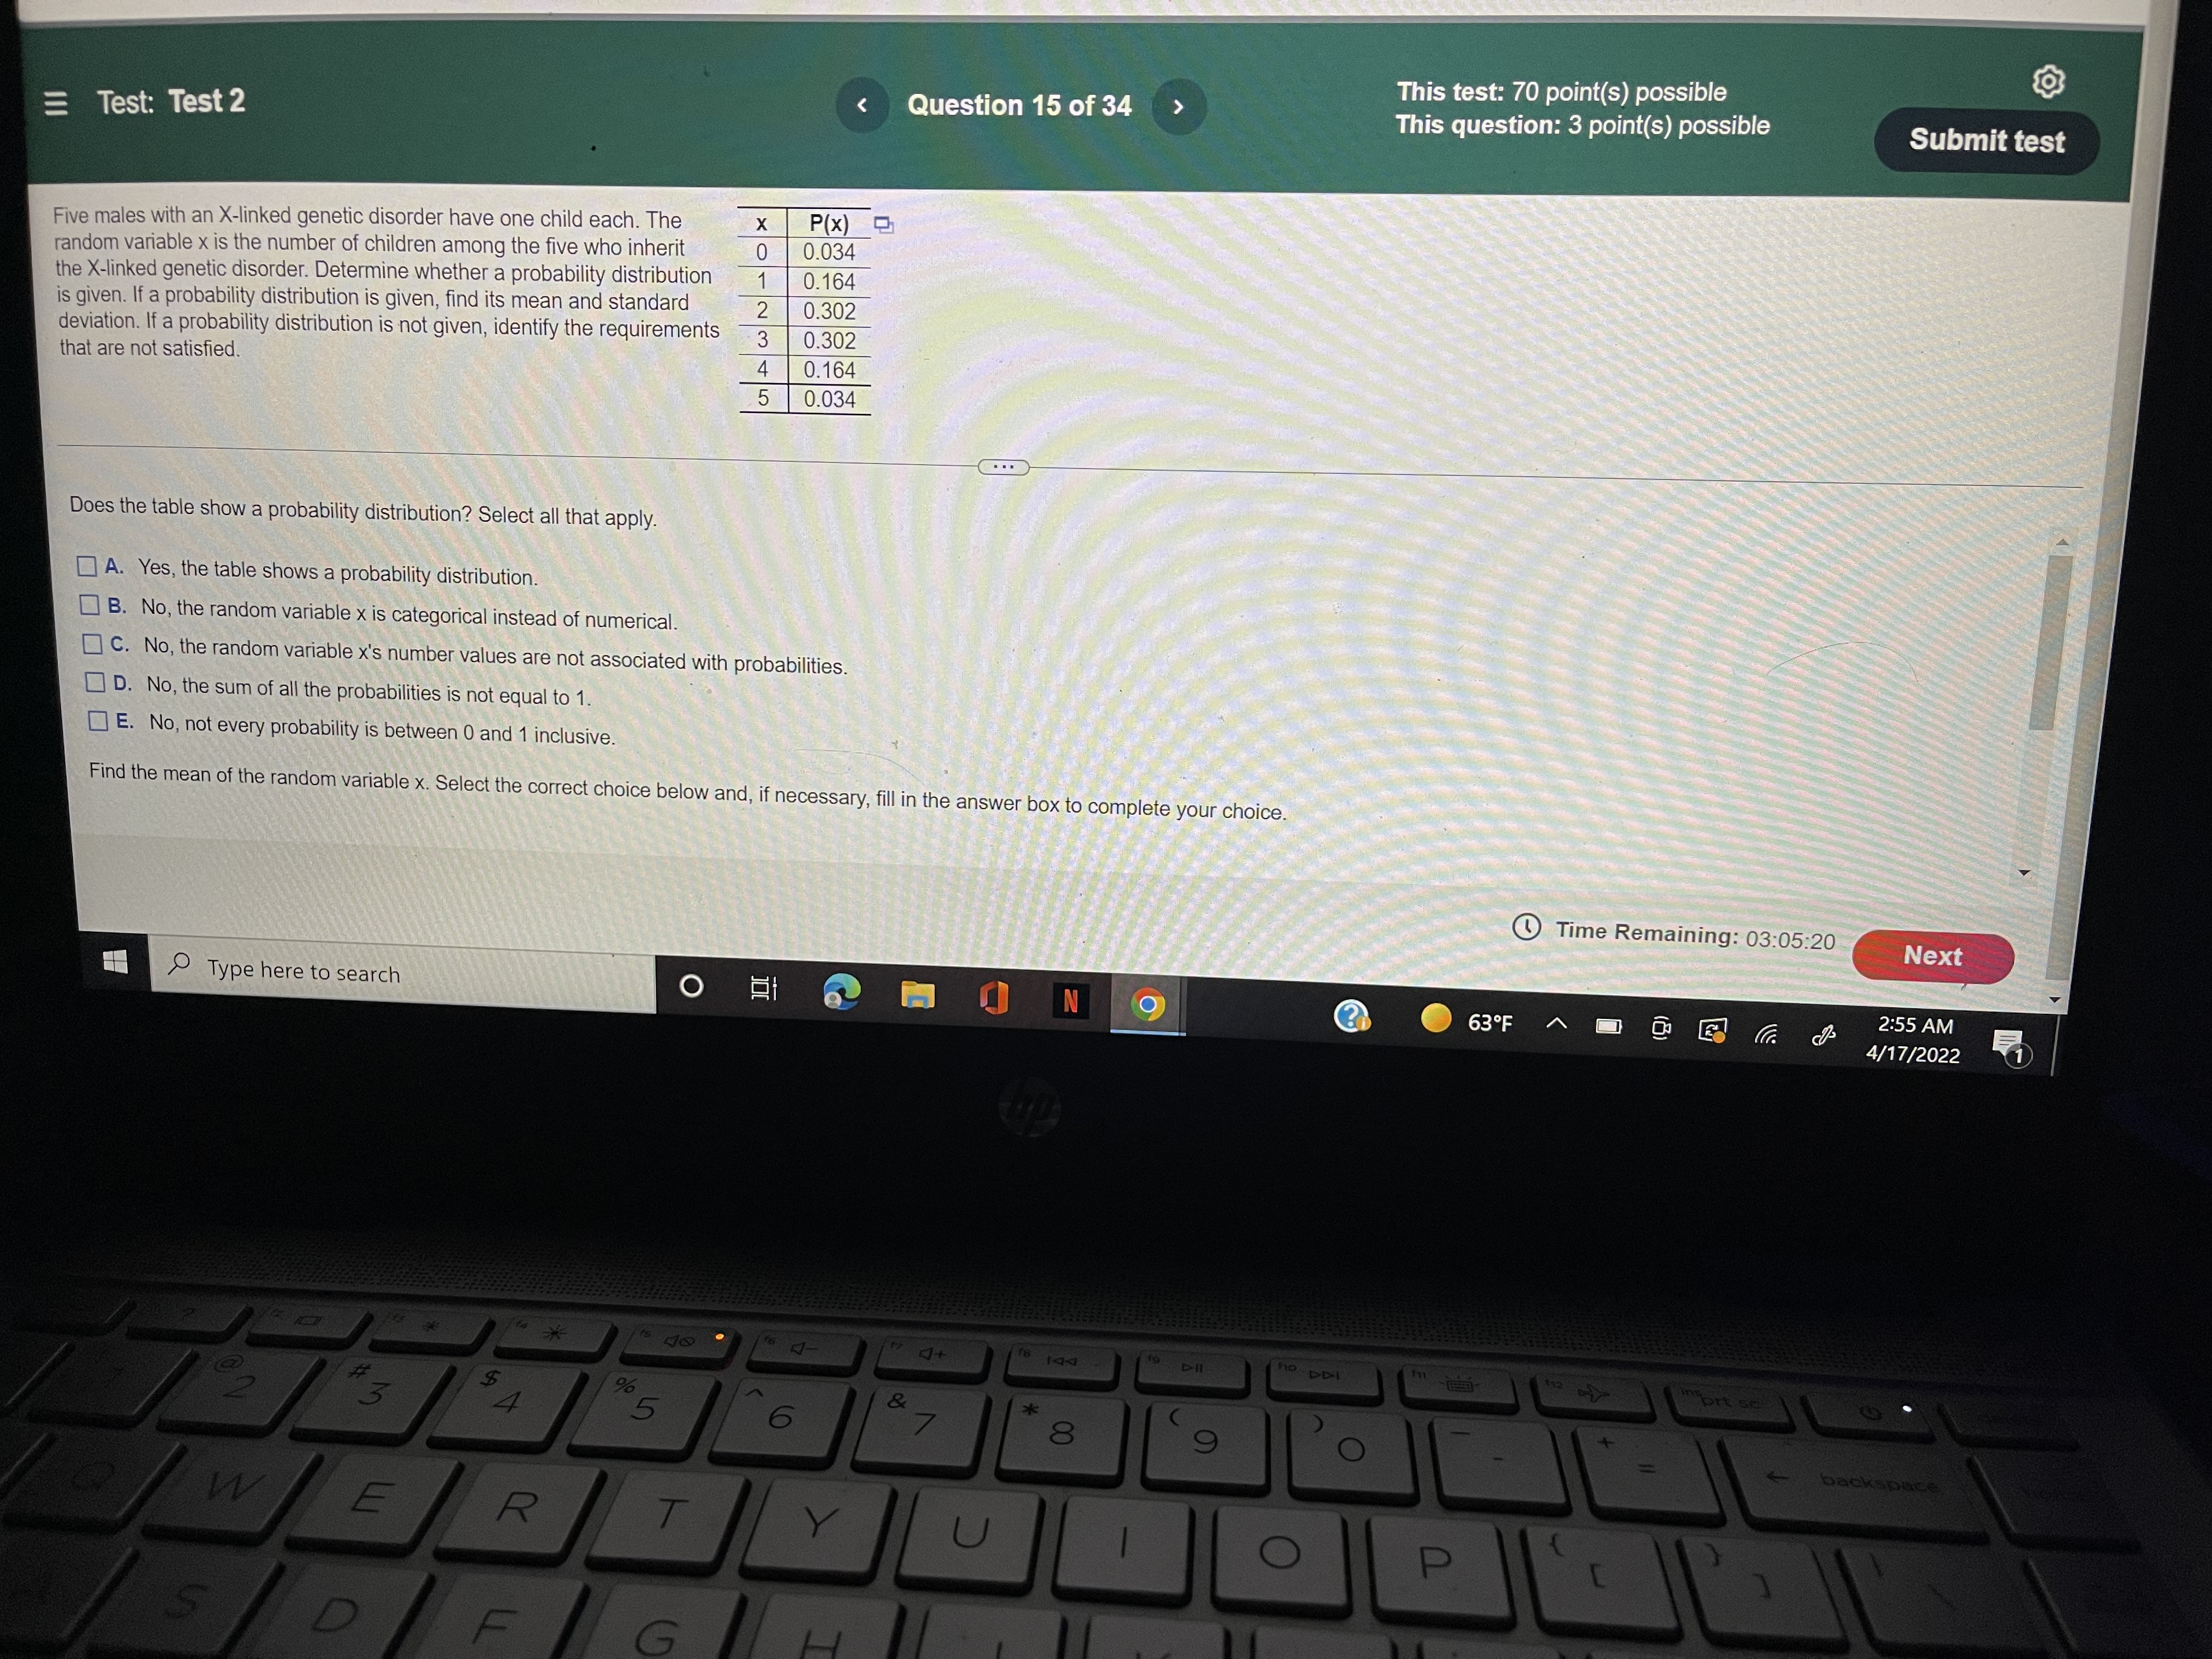
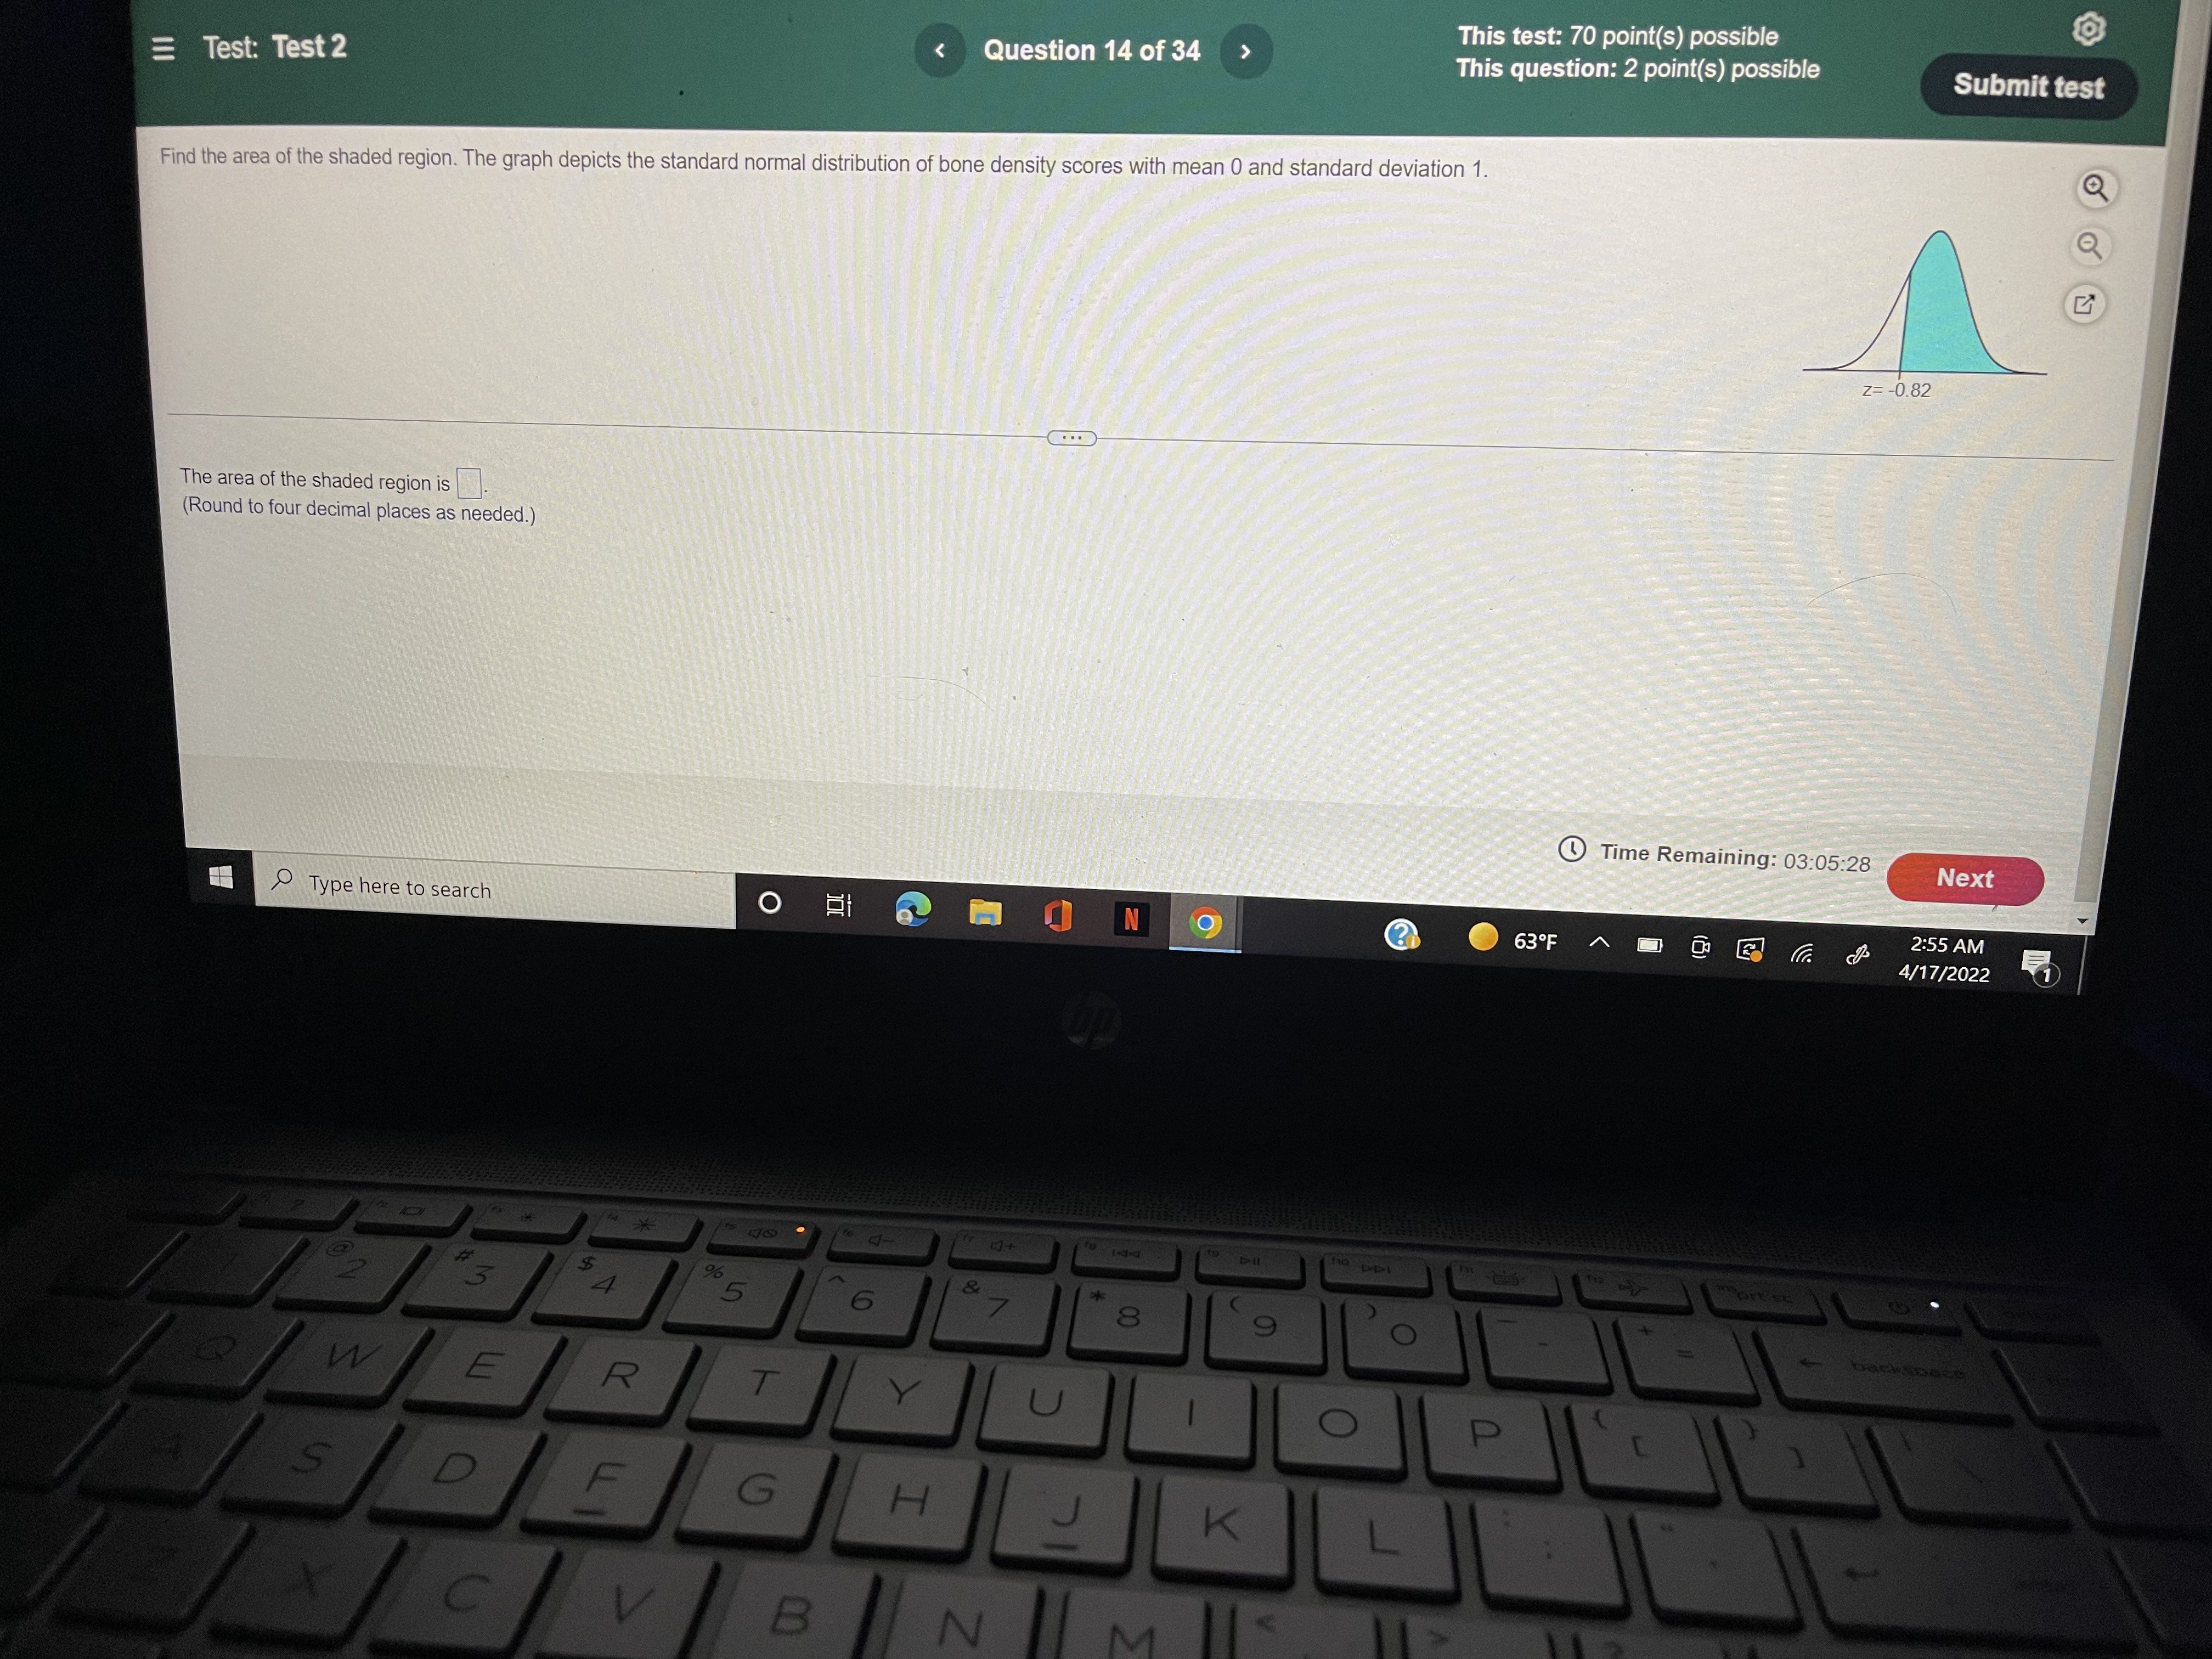
= Test: Test2 Question 11 of 34 This test: 70 point(s) possible This question: 2 point(s) possible Submit test Find the area of the shaded region. The graph to the right depicts IQ scores of adults, and those scores are normally distributed with a mean of 100 and a standard deviation of 15. Cllq-view-page 1 of the table. Click to view page 2 of the table. D. (Round to four decimal places as needed.) The area of the shaded region is 80 p Type here to search Time Remaining: 03:06:15 0 630F A @ f: Next 2:54 AM 4/17/2022
Step by Step Solution
There are 3 Steps involved in it
1 Expert Approved Answer
Step: 1 Unlock

Question Has Been Solved by an Expert!
Get step-by-step solutions from verified subject matter experts
Step: 2 Unlock
Step: 3 Unlock