

Question: This the question and the excel file I need answer early please Thanks Name: Student ID Instructions Carbon Monoxide Level Use your computer to answer
This the question and the excel file I need answer early please Thanks
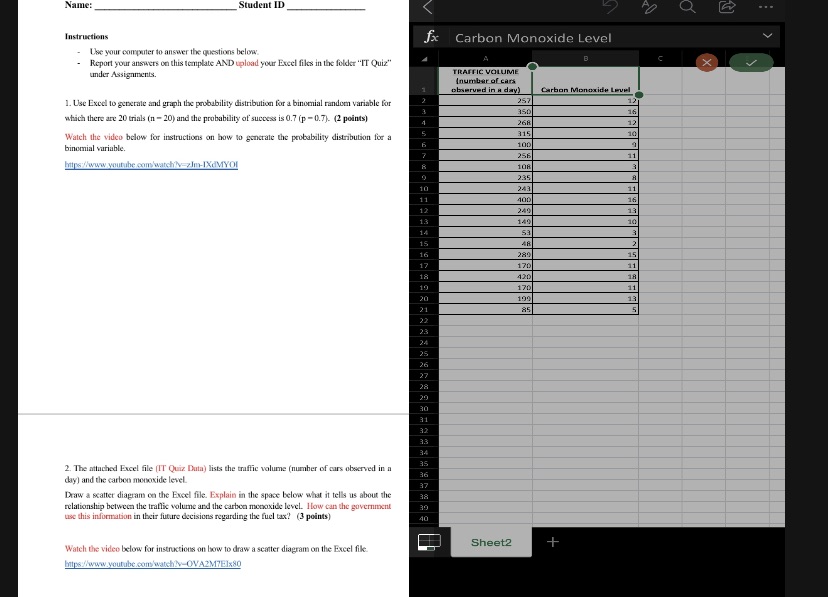
Name: Student ID Instructions Carbon Monoxide Level Use your computer to answer the questions below. Report your answers on this template AND upload your Excel files in the fokker "IT Quiz" B X under Assignments. TRAFFIC VOLUME Inumber of cars observed in a day) Carbon Monoxide Level 1. Use Excel to generate and graph the probability distribution for a binomial random variable for 257 12 which there are 20 trials (n - 20) and the probability of success is 0.7 (p -0.7). (2 points) 16 12 Watch the video below for instructions on how to generale the probability distribution for a binomial variable. 100 256 108 235 243 14 15 16 17 18 2. The attached Excel file (IT Quiz Data) lists the traffic volume (number of cars observed in a day) and the carbon monoxide level. Draw a scatter diagram on the Excel file. Explain in the space below what it tells us about the relationship between the traffic volume and the carbon monoxide level. How can the government use this information in their future decisions regarding the fuel tax? (3 points) 40 Watch the video below for instructions on how to draw a scatter diagram on the Excel file. Sheet2 F hilpew/www.youtube .com>/watchv-OVA2M7EIx80
Step by Step Solution
There are 3 Steps involved in it

Get step-by-step solutions from verified subject matter experts