

Question: This week we do something useful with our z-values by using them to: Create CONFIDENCE INTERVALS around the mean, and TEST HYPOTHESES to see just
This week we do something useful with our z-values by using them to:
- Create CONFIDENCE INTERVALS around the mean, and
- TEST HYPOTHESES to see just how "sure" we are that they are statistically supported
CONFIDENCE INTERVALS
The z-values can be used to construct a confidence interval for a PROPORTION (%)If TWO conditions about the sampling distribution and sample size are met:
- The Sampling Distribution must be a Normal (bell) Distribution (histogram bell-shaped?), or you can Multiply the sample size times the proportion probability (np), then n times the alternate probability n (1 - p) and IF BOTH are 5 or greater, it's a Normal Distribution.
- The Sample Size (n) must be 30 or greater.
Now let's actually calculate a Confidence Interval around a Population mean, based on SAMPLE data.
1)The 896 residents of a retirement community were tested for Covid-19 and 120 tested positive. What is the 95% confidence interval around the TRUE proportion infected? Fill in the blanks:
n = _____, sample proportion infected (p-hat) = ________; sampling proportion not infected (q-hat) = ______
? = _____ and ?/2 = ______ so, the Critical +z-value (zc) = _________ ;
a) Calculate the Margin of Error boundary,E= zc * SQRT [( p * q)] = ________ (don't forget this formula !)
b) Calculate the Confidence Interval: p-hat - E
c) State what this means:
2)(made-up problem)PROPORTION problem (use z)
35000 students took Stat 200 and 29000 passed. At the 1% significance level, what is the confidence interval around this proportion?
a) x = _______; n = ____________; p-hat =___________; q-hat = ___________; zc= ____________
b) Using the formula for E, what is this margin of error?______________ (show setup and final value)
c) What is the Confidence Interval? _________
NOW,what if either or both of the two conditions required to use the critical z-values are NOT met?
We use t- values. Unlike z-values, t-values depend on sample size (n) but if "n" gets up around 1000, the t-distribution looks more and more like the z-distribution (the Normal bell curve) and the z-values and t-values are almost equal:
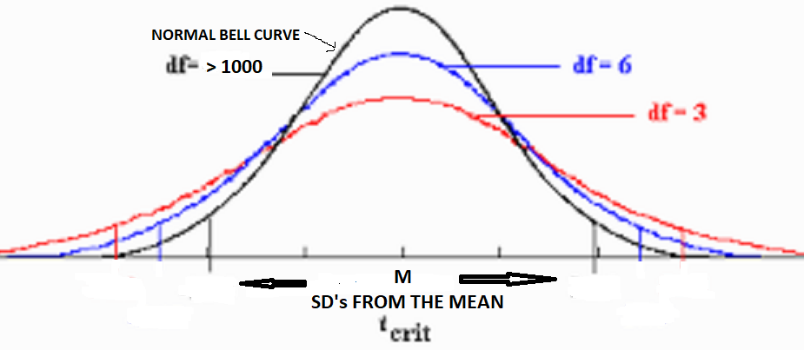
NORMAL BELL CURVE df- > 1000 9 - JP df - 3 M SD's FROM THE MEAN crit\f\f
Step by Step Solution
There are 3 Steps involved in it

Get step-by-step solutions from verified subject matter experts