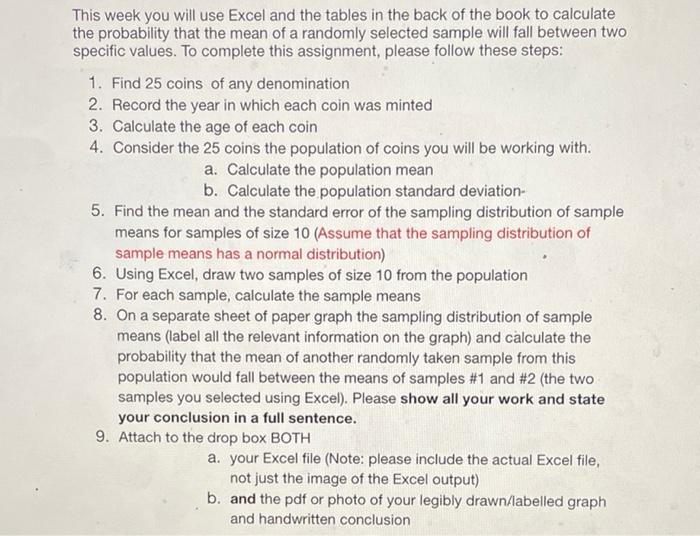
Question: This week you will use Excel and the tables in the back of the book to calculate the probability that the mean of a randomly

This week you will use Excel and the tables in
This week you will use Excel and the tables in the back of the book to calculate the probability that the mean of a randomly selected sample will fall between two specific values. To complete this assignment, please follow these steps: 1. Find 25 coins of any denomination 2. Record the year in which each coin was minted 3. Calculate the age of each coin 4. Consider the 25 coins the population of coins you will be working with. a. Calculate the population mean b. Calculate the population standard deviation- 5. Find the mean and the standard error of the sampling distribution of sample means for samples of size 10 (Assume that the sampling distribution of sample means has a normal distribution) 6. Using Excel, draw two samples of size 10 from the population 7. For each sample, calculate the sample means 8. On a separate sheet of paper graph the sampling distribution of sample means (label all the relevant information on the graph) and calculate the probability that the mean of another randomly taken sample from this population would fall between the means of samples #1 and #2 (the two samples you selected using Excel). Please show all your work and state your conclusion in a full sentence. 9. Attach to the drop box BOTH a. your Excel file (Note: please include the actual Excel file, not just the image of the Excel output) b. and the pdf or photo of your legibly drawn/labelled graph and handwritten conclusion This week you will use Excel and the tables in the back of the book to calculate the probability that the mean of a randomly selected sample will fall between two specific values. To complete this assignment, please follow these steps: 1. Find 25 coins of any denomination 2. Record the year in which each coin was minted 3. Calculate the age of each coin 4. Consider the 25 coins the population of coins you will be working with. a. Calculate the population mean b. Calculate the population standard deviation- 5. Find the mean and the standard error of the sampling distribution of sample means for samples of size 10 (Assume that the sampling distribution of sample means has a normal distribution) 6. Using Excel, draw two samples of size 10 from the population 7. For each sample, calculate the sample means 8. On a separate sheet of paper graph the sampling distribution of sample means (label all the relevant information on the graph) and calculate the probability that the mean of another randomly taken sample from this population would fall between the means of samples #1 and #2 (the two samples you selected using Excel). Please show all your work and state your conclusion in a full sentence. 9. Attach to the drop box BOTH a. your Excel file (Note: please include the actual Excel file, not just the image of the Excel output) b. and the pdf or photo of your legibly drawn/labelled graph and handwritten conclusion

Step by Step Solution

There are 3 Steps involved in it

1 Expert Approved Answer
Step: 1 Unlock blur-text-image
Question Has Been Solved by an Expert!

Get step-by-step solutions from verified subject matter experts

Step: 2 Unlock
Step: 3 Unlock

Students Have Also Explored These Related General Management Questions!