

Question: This workbook contains some new data for you to practice what you learned in module 3. Copy Sheet This sheet contains data that you will
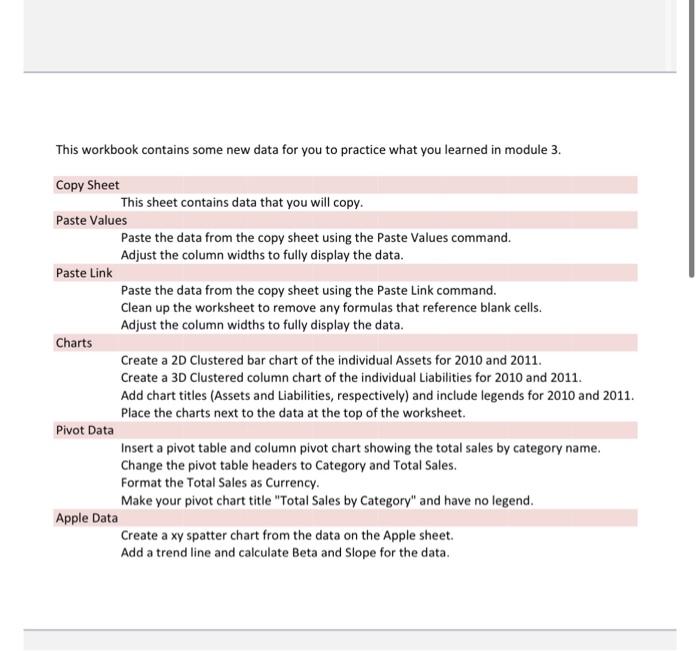
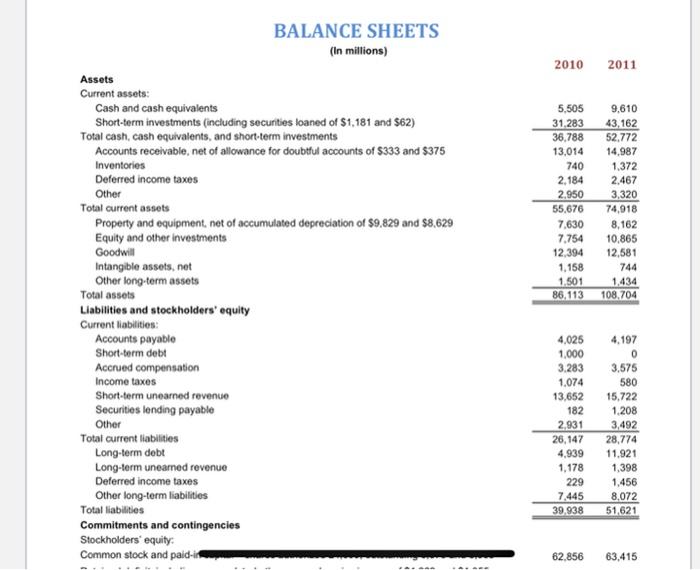
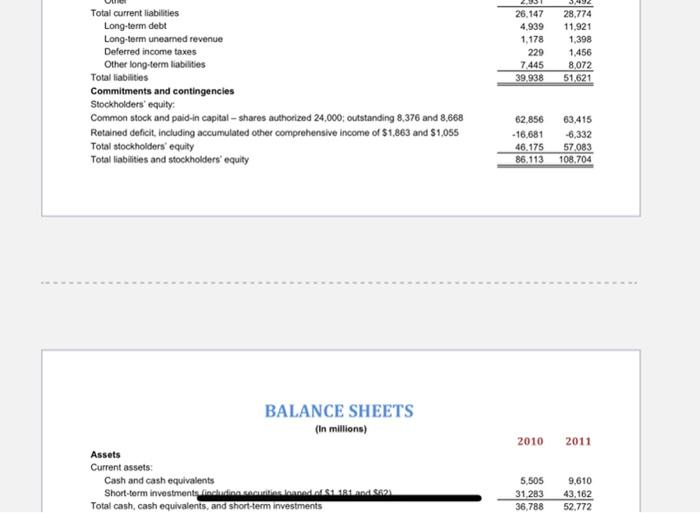
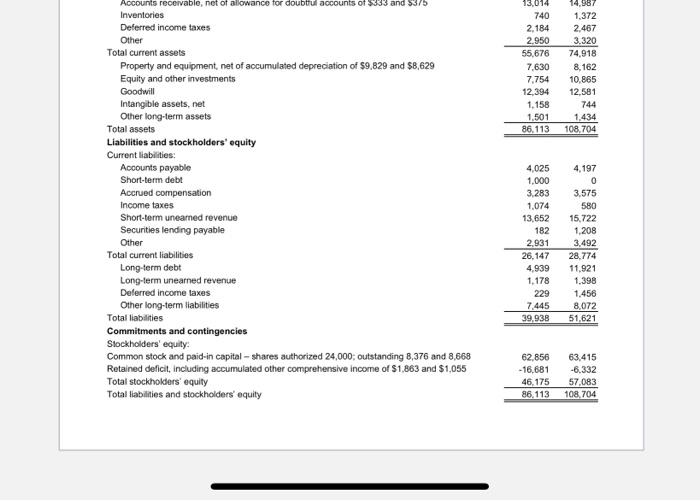
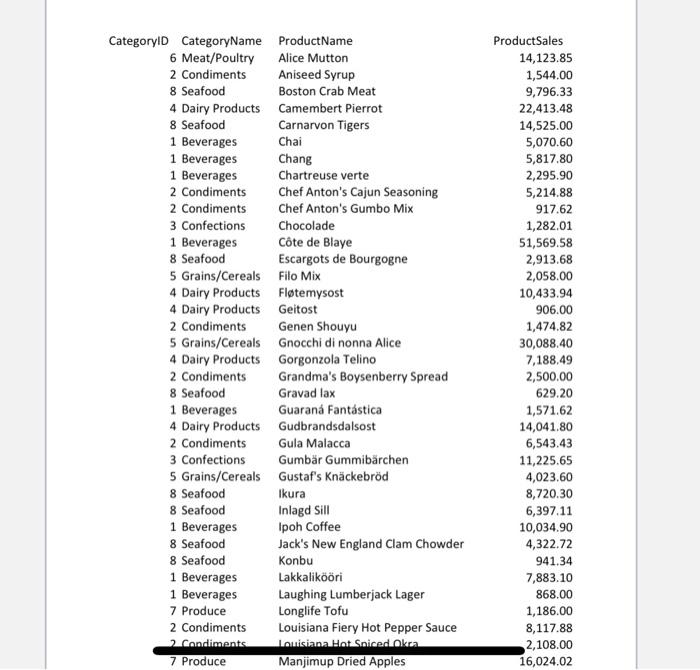
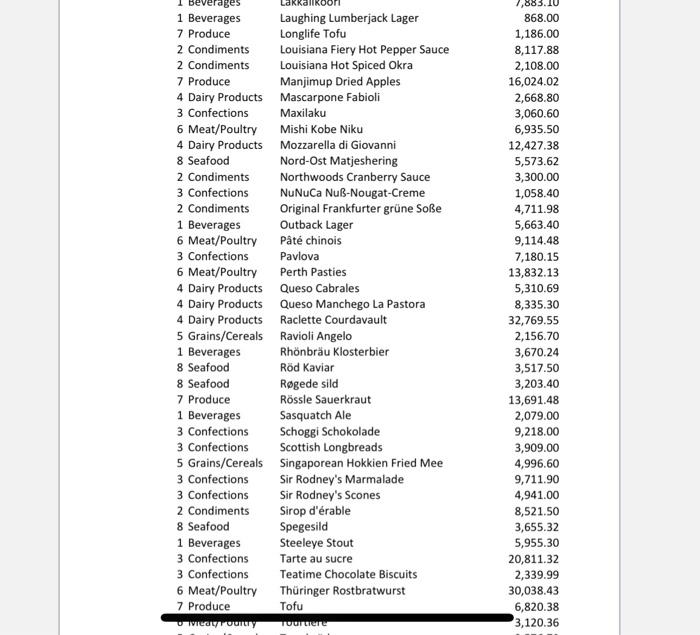
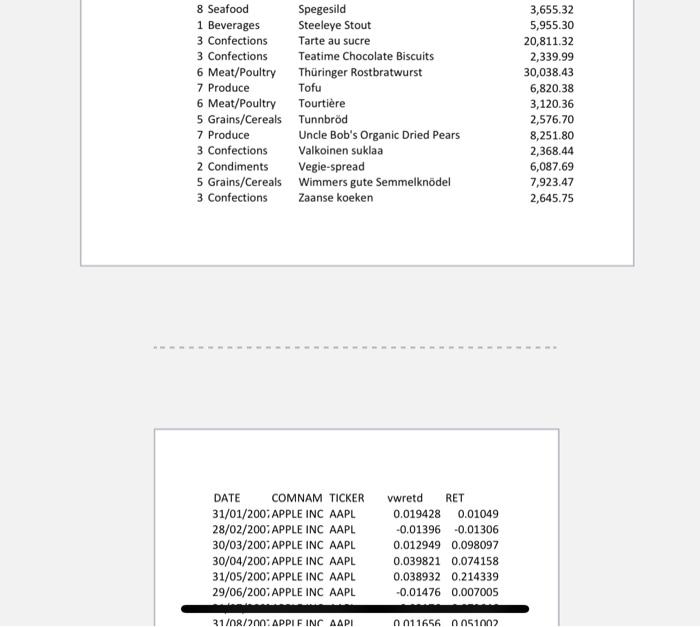
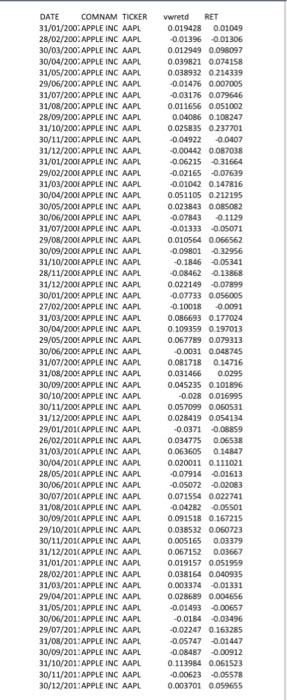
This workbook contains some new data for you to practice what you learned in module 3. Copy Sheet This sheet contains data that you will copy. Paste Values Paste the data from the copy sheet using the Paste Values command. Adjust the column widths to fully display the data. Paste Link Paste the data from the copy sheet using the Paste Link command. Clean up the worksheet to remove any formulas that reference blank cells. Adjust the column widths to fully display the data. Charts Create a 2D Clustered bar chart of the individual Assets for 2010 and 2011. Create a 3D Clustered column chart of the individual Liabilities for 2010 and 2011. Add chart titles (Assets and Liabilities, respectively) and include legends for 2010 and 2011. Place the charts next to the data at the top of the worksheet. Pivot Data Insert a pivot table and column pivot chart showing the total sales by category name. Change the pivot table headers to Category and Total Sales. Format the Total Sales as Currency. Make your pivot chart title "Total Sales by Category" and have no legend. Apple Data Create a xy spatter chart from the data on the Apple sheet. Add a trend line and calculate Beta and Slope for the data. 2010 2011 BALANCE SHEETS (In millions) Assets Current assets: Cash and cash equivalents Short-term investments (including securities loaned of $1,181 and $62) Total cash, cash equivalents, and short-term investments Accounts receivable, net of allowance for doubtful accounts of $333 and $375 Inventories Deferred income taxes Other Total current assets Property and equipment, net of accumulated depreciation of $9,829 and $8,629 Equity and other investments Goodwill Intangible assets, net Other long-term assets Total assets Liabilities and stockholders' equity Current liabilities: Accounts payable Short-term debt Accrued compensation Income taxes Short-term unearned revenue Securities lending payable Other Total current liabilities Long-term debt Long-term unearned revenue Deferred income taxes Other long-term liabilities Total liabilities Commitments and contingencies Stockholders' equity: Common stock and paid-i 5,505 9,610 31,283 43,162 36.788 52.772 13,014 14.987 740 1.372 2.184 2.467 2.950 3,320 55.676 74,918 7.630 8,162 7.754 10,865 12,394 12,581 1.158 744 1.501 1.434 86.113 108.704 4,025 1,000 3.283 1.074 13,652 182 2.931 26,147 4.939 1,178 229 7.445 39.938 4.197 0 3,575 580 15.722 1.208 3,492 28,774 11.921 1,398 1.456 8,072 51,621 62.856 63.415 26.147 4.939 1,178 229 7.445 39.938 28.774 11.921 1,398 1,456 8,072 51,621 Total current liabilities Long-term debt Long-term uneared revenue Deferred income taxes Other long-term liabilities Total liabilities Commitments and contingencies Stockholders' equity Common stock and paid-in capital - shares authorized 24,000; outstanding 8,376 and 8,668 Retained deficit, including accumulated other comprehensive income of $1,863 and $1,055 Total stockholders' equity Total liabilities and stockholders' equity 62,856 - 16,681 46.175 86,113 63.415 -6,332 57083 108,704 BALANCE SHEETS (In millions) 2010 2011 Assets Current assets: Cash and cash equivalents Short-term investments include condold 21 Total cash, cash equivalents, and short-term investments 5.505 31 283 36,788 9,610 43,162 52.772 13,014 740 2.184 2,950 55,676 7,630 7,754 12,394 1.158 1,501 86.113 14,987 1,372 2,467 3.320 74,918 8,162 10.865 12,581 744 1,434 108,704 4,025 1.000 Accounts receivable, net of allowance for doubtful accounts of $333 and 5375 Inventories Deferred income taxes Other Total current assets Property and equipment, net of accumulated depreciation of $9,829 and $8,629 Equity and other investments Goodwill Intangible assets, net Other long-term assets Total assets Liabilities and stockholders' equity Current liabilities: Accounts payable Short-term debt Accrued compensation Income taxes Short-term unearned revenue Securities lending payable Other Total current liabilities Long-term debt Long-term unearned revenue Deferred income taxes Other long-term liabilities Total liabilities Commitments and contingencies Stockholders' equity: Common stock and paid-in capital - shares authorized 24,000: Outstanding 8,376 and 8,568 Retained deficit, including accumulated other comprehensive income of $1,863 and $1,055 Total stockholders' equity Total liabilities and stockholders' equity 3.283 1,074 13,652 182 2.931 26, 147 4,939 1,178 229 7.445 39,938 4,197 0 3.575 580 15.722 1.208 3.492 28.774 11.921 1,398 1.456 8,072 51,621 62,856 -16,681 46,175 86,113 63.415 -6.332 57,083 108.704 CategoryID CategoryName Product Name 6 Meat/Poultry Alice Mutton 2 Condiments Aniseed Syrup 8 Seafood Boston Crab Meat 4 Dairy Products Camembert Pierrot 8 Seafood Carnarvon Tigers 1 Beverages Chai 1 Beverages Chang 1 Beverages Chartreuse verte 2 Condiments Chef Anton's Cajun Seasoning 2 Condiments Chef Anton's Gumbo Mix 3 Confections Chocolade 1 Beverages Cte de Blaye 8 Seafood Escargots de Bourgogne 5 Grains/Cereals Filo Mix 4 Dairy Products Fltemysost 4 Dairy Products Geitost 2 Condiments Genen Shouyu 5 Grains/Cereals Gnocchi di nonna Alice 4 Dairy Products Gorgonzola Telino 2 Condiments Grandma's Boysenberry Spread 8 Seafood Gravad lax 1 Beverages Guaran Fantstica 4 Dairy Products Gudbrandsdalsost 2 Condiments Gula Malacca 3 Confections Gumbr Gummibrchen 5 Grains/Cereals Gustaf's Knckebrd 8 Seafood Ikura 8 Seafood Inlagd Sill 1 Beverages Ipoh Coffee 8 Seafood Jack's New England Clam Chowder 8 Seafood Konbu 1 Beverages Lakkalikri 1 Beverages Laughing Lumberjack Lager 7 Produce Longlife Tofu 2 Condiments Louisiana Fiery Hot Pepper Sauce Condiments Louisiana Hot Sniced Okra 7 Produce Manjimup Dried Apples ProductSales 14,123.85 1,544.00 9,796.33 22,413.48 14,525.00 5,070.60 5,817.80 2,295.90 5,214.88 917.62 1,282.01 51,569.58 2,913.68 2,058.00 10,433.94 906.00 1,474.82 30,088.40 7,188,49 2,500.00 629.20 1,571.62 14,041.80 6,543.43 11,225.65 4,023.60 8,720.30 6,397.11 10,034.90 4,322.72 941.34 7,883.10 868.00 1,186.00 8,117.88 2,108.00 16,024.02 Beverages 1 Beverages Laughing Lumberjack Lager 7 Produce Longlife Tofu 2 Condiments Louisiana Fiery Hot Pepper Sauce 2 Condiments Louisiana Hot Spiced Okra 7 Produce Manjimup Dried Apples 4 Dairy Products Mascarpone Fabioli 3 Confections Maxilaku 6 Meat/Poultry Mishi Kobe Niku 4 Dairy Products Mozzarella di Giovanni 8 Seafood Nord-Ost Matjeshering 2 Condiments Northwoods Cranberry Sauce 3 Confections NuNuCa Nu-Nougat-Creme 2 Condiments Original Frankfurter grne Soe 1 Beverages Outback Lager 6 Meat/Poultry Pt chinois 3 Confections Pavlova 6 Meat/Poultry Perth Pasties 4 Dairy Products Queso Cabrales 4 Dairy Products Queso Manchego La Pastora 4 Dairy Products Raclette Courdavault 5 Grains/Cereals Ravioli Angelo 1 Beverages Rhnbru Klosterbier 8 Seafood Rd Kaviar 8 Seafood Rgede sild 7 Produce Rssle Sauerkraut 1 Beverages Sasquatch Ale 3 Confections Schoggi Schokolade 3 Confections Scottish Longbreads 5 Grains/Cereals Singaporean Hokkien Fried Mee 3 Confections Sir Rodney's Marmalade 3 Confections Sir Rodney's Scones 2 Condiments Sirop d'rable 8 Seafood Spegesild 1 Beverages Steeleye Stout 3 Confections Tarte au sucre 3 Confections Teatime Chocolate Biscuits 6 Meat/Poultry Thringer Rostbratwurst 7 Produce Tofu WILLY Tourter 7,883. IU 868.00 1,186.00 8,117.88 2,108.00 16,024.02 2,668.80 3,060.60 6,935.50 12,427.38 5,573.62 3,300.00 1,058.40 4,711.98 5,663.40 9,114.48 7,180.15 13,832.13 5,310.69 8,335.30 32,769.55 2,156.70 3,670.24 3,517.50 3,203.40 13,691.48 2,079.00 9,218.00 3,909.00 4,996.60 9,711.90 4,941.00 8,521.50 3,655.32 5,955.30 20,811.32 2,339.99 30,038.43 6,820.38 3,120.36 8 Seafood Spegesild 1 Beverages Steeleye Stout 3 Confections Tarte au sucre 3 Confections Teatime Chocolate Biscuits 6 Meat/Poultry Thringer Rostbratwurst 7 Produce Tofu 6 Meat/Poultry Tourtire 5 Grains/Cereals Tunnbrd 7 Produce Uncle Bob's Organic Dried Pears 3 Confections Valkoinen suklaa 2 Condiments Vegie-spread 5 Grains/Cereals Wimmers gute Semmelkndel 3 Confections Zaanse koeken 3,655.32 5,955.30 20,811.32 2,339.99 30,038.43 6,820.38 3,120.36 2,576.70 8,251.80 2,368.44 6,087.69 7,923.47 2,645.75 DATE COMNAM TICKER 31/01/2007 APPLE INC AAPL 28/02/2007 APPLE INC AAPL 30/03/2007 APPLE INC AAPL 30/04/2007 APPLE INC AAPL 31/05/200: APPLE INC AAPL 29/06/200: APPLE INC AAPL vwretd RET 0.019428 0.01049 -0.01396 -0.01306 0.012949 0.098097 0.039821 0.074158 0.038932 0.214339 -0.01476 0.007005 31/08/200: APPLE INC AAPI nn11656 051002 DATE COMNAM TICKER 31/01/200.APPLE INC AAPL 28/02/200.APPLE INC AAPL 30/03/200.APPLE INC AAPL 30/04/200: APPLE INC AAPL 31/05/200: APPLE INC AAPL 29/06/200 APPLE INC AAPL 31/07/200 APPLE INC AAPL 31/08/200: APPLE INC AAPL 28/09/200 APPLE INC AAPL 31/10/200 APPLE INC AAPL 30/11/200 APPLE INC AAPL 31/12/200.APPLE INC AAPL 31/01/200F APPLE INC AAPL 29/02/200E APPLE INC AAPL 31/03/200E APPLE INC AAPL 30/04/2001 APPLE INC AAPL 30/05/2004 APPLE INC AAPL 30/06/200F APPLE INC AAPL 31/07/2001 APPLE INC AAPL 29/08/2008 APPLE INC AAPL 30/09/2008 APPLE INC AAPL 31/10/200E APPLE INC AAPL 28/11/2008 APPLE INC AAPL 31/12/200F APPLE INC AAPL 30/01/2008 APPLE INC AAPL 27/02/200: APPLE INC AAPL 31/03/200: APPLE INC AAPL 30/04/2005 APPLE INC AAPL 29/05/2005 APPLE INC AAPL 30/06/200: APPLE INC AAPL 31/07/2008 APPLE INC AAPL 31/08/2004 APPLE INC AAPL 30/09/2005 APPLE INC AAPL 30/10/2008 APPLE INC AAPL 30/11/200APPLE INC AAPL 31/12/2005 APPLE INC AAPL 29/01/201C APPLE INC AAPL 26/02/2017 APPLE INC AAPL 31/03/2010 APPLE INC AAPL 30/04/2016 APPLE INC AAPL 28/05/2011 APPLE INC AAPL 30/06/2017 APPLE INC AAPL 30/07/2016 APPLE INC AAPL 31/08/2010 APPLE INC AAPL 30/09/2010 APPLE INC AAPL 29/10/201C APPLE INC AAPL 30/11/2016 APPLE INC AAPL 31/12/2016 APPLE INC AAPL 31/01/2018 APPLE INC AAPL 28/02/201: APPLE INC AAPL 31/03/201: APPLE INC AAPL 29/04/2011 APPLE INC AAPL 31/05/2013 APPLE INC AAPL 30/06/2011 APPLE INC AAPL 29/07/2011 APPLE INC AAPL 31/08/2011 APPLE INC AAPL 30/09/2011 APPLE INC AAPL 31/10/2011 APPLE INC AAPL 30/11/2011 APPLE INC AAPL 30/12/2011 APPLE INC AAPL wwred RET 0.019428 0.01049 -0.01396 0.01306 0.012949 0.098097 0.039821 0.074158 0.038932 0.214339 -0.01476 0.007005 -0.03176 0.079646 0.011656 0.051002 0.04086 0.108247 0.025835 0.237701 -0.04922 -0.0407 -0.00442 0.087038 -0.06215031664 -0.02165 0.07639 -0.01042 0.147816 0.051105 0212195 0.023843 0.085062 -0.07843 -0.1129 -0.01333 -0.05071 0.010564 0.066562 -0.09801 -0.32956 -0.1846 -0.05341 -0.08462 0.13868 0.022149 0.07899 -0.07733 0.05600 -0.10018 00091 0.086693 0.177024 0.109359 0.197013 0.067789 0.079313 -0.0031 0.048745 0.081718 0.14716 0.031466 0.0295 0.045235 0.101896 -0.028 0.016995 0.057099 0.060531 0.028419 0.054134 -0.0371 -0.08859 0.034775 0.06538 0.063605 0.14847 0.020011 0111021 -0.07914 0.01613 -0.05072 -0.02083 0.071554 0.022741 -0.04282 0.05501 0.091518 0.167215 0.038532 0.060723 0.005165 0.03379 0.067152 0.03667 0.019157 0.051959 0.038164 0.040935 0.003374 -0.01331 0.028689 0.004656 -0.01493 -0.00657 -0.0184 0.03496 -0.02247 0163285 -0.05747 -0.01447 -0.08487 -0.00912 0.113984 0.061523 -0.00623 -0.05578 0.003701 0.059655 Question 1 1 pts What is the cell contents (not the value, what shows in the formula bar) of cell A2 on the Paste Link tab? Be specific, include all punctuation, if applicable. This workbook contains some new data for you to practice what you learned in module 3. Copy Sheet This sheet contains data that you will copy. Paste Values Paste the data from the copy sheet using the Paste Values command. Adjust the column widths to fully display the data. Paste Link Paste the data from the copy sheet using the Paste Link command. Clean up the worksheet to remove any formulas that reference blank cells. Adjust the column widths to fully display the data. Charts Create a 2D Clustered bar chart of the individual Assets for 2010 and 2011. Create a 3D Clustered column chart of the individual Liabilities for 2010 and 2011. Add chart titles (Assets and Liabilities, respectively) and include legends for 2010 and 2011. Place the charts next to the data at the top of the worksheet. Pivot Data Insert a pivot table and column pivot chart showing the total sales by category name. Change the pivot table headers to Category and Total Sales. Format the Total Sales as Currency. Make your pivot chart title "Total Sales by Category" and have no legend. Apple Data Create a xy spatter chart from the data on the Apple sheet. Add a trend line and calculate Beta and Slope for the data. 2010 2011 BALANCE SHEETS (In millions) Assets Current assets: Cash and cash equivalents Short-term investments (including securities loaned of $1,181 and $62) Total cash, cash equivalents, and short-term investments Accounts receivable, net of allowance for doubtful accounts of $333 and $375 Inventories Deferred income taxes Other Total current assets Property and equipment, net of accumulated depreciation of $9,829 and $8,629 Equity and other investments Goodwill Intangible assets, net Other long-term assets Total assets Liabilities and stockholders' equity Current liabilities: Accounts payable Short-term debt Accrued compensation Income taxes Short-term unearned revenue Securities lending payable Other Total current liabilities Long-term debt Long-term unearned revenue Deferred income taxes Other long-term liabilities Total liabilities Commitments and contingencies Stockholders' equity: Common stock and paid-i 5,505 9,610 31,283 43,162 36.788 52.772 13,014 14.987 740 1.372 2.184 2.467 2.950 3,320 55.676 74,918 7.630 8,162 7.754 10,865 12,394 12,581 1.158 744 1.501 1.434 86.113 108.704 4,025 1,000 3.283 1.074 13,652 182 2.931 26,147 4.939 1,178 229 7.445 39.938 4.197 0 3,575 580 15.722 1.208 3,492 28,774 11.921 1,398 1.456 8,072 51,621 62.856 63.415 26.147 4.939 1,178 229 7.445 39.938 28.774 11.921 1,398 1,456 8,072 51,621 Total current liabilities Long-term debt Long-term uneared revenue Deferred income taxes Other long-term liabilities Total liabilities Commitments and contingencies Stockholders' equity Common stock and paid-in capital - shares authorized 24,000; outstanding 8,376 and 8,668 Retained deficit, including accumulated other comprehensive income of $1,863 and $1,055 Total stockholders' equity Total liabilities and stockholders' equity 62,856 - 16,681 46.175 86,113 63.415 -6,332 57083 108,704 BALANCE SHEETS (In millions) 2010 2011 Assets Current assets: Cash and cash equivalents Short-term investments include condold 21 Total cash, cash equivalents, and short-term investments 5.505 31 283 36,788 9,610 43,162 52.772 13,014 740 2.184 2,950 55,676 7,630 7,754 12,394 1.158 1,501 86.113 14,987 1,372 2,467 3.320 74,918 8,162 10.865 12,581 744 1,434 108,704 4,025 1.000 Accounts receivable, net of allowance for doubtful accounts of $333 and 5375 Inventories Deferred income taxes Other Total current assets Property and equipment, net of accumulated depreciation of $9,829 and $8,629 Equity and other investments Goodwill Intangible assets, net Other long-term assets Total assets Liabilities and stockholders' equity Current liabilities: Accounts payable Short-term debt Accrued compensation Income taxes Short-term unearned revenue Securities lending payable Other Total current liabilities Long-term debt Long-term unearned revenue Deferred income taxes Other long-term liabilities Total liabilities Commitments and contingencies Stockholders' equity: Common stock and paid-in capital - shares authorized 24,000: Outstanding 8,376 and 8,568 Retained deficit, including accumulated other comprehensive income of $1,863 and $1,055 Total stockholders' equity Total liabilities and stockholders' equity 3.283 1,074 13,652 182 2.931 26, 147 4,939 1,178 229 7.445 39,938 4,197 0 3.575 580 15.722 1.208 3.492 28.774 11.921 1,398 1.456 8,072 51,621 62,856 -16,681 46,175 86,113 63.415 -6.332 57,083 108.704 CategoryID CategoryName Product Name 6 Meat/Poultry Alice Mutton 2 Condiments Aniseed Syrup 8 Seafood Boston Crab Meat 4 Dairy Products Camembert Pierrot 8 Seafood Carnarvon Tigers 1 Beverages Chai 1 Beverages Chang 1 Beverages Chartreuse verte 2 Condiments Chef Anton's Cajun Seasoning 2 Condiments Chef Anton's Gumbo Mix 3 Confections Chocolade 1 Beverages Cte de Blaye 8 Seafood Escargots de Bourgogne 5 Grains/Cereals Filo Mix 4 Dairy Products Fltemysost 4 Dairy Products Geitost 2 Condiments Genen Shouyu 5 Grains/Cereals Gnocchi di nonna Alice 4 Dairy Products Gorgonzola Telino 2 Condiments Grandma's Boysenberry Spread 8 Seafood Gravad lax 1 Beverages Guaran Fantstica 4 Dairy Products Gudbrandsdalsost 2 Condiments Gula Malacca 3 Confections Gumbr Gummibrchen 5 Grains/Cereals Gustaf's Knckebrd 8 Seafood Ikura 8 Seafood Inlagd Sill 1 Beverages Ipoh Coffee 8 Seafood Jack's New England Clam Chowder 8 Seafood Konbu 1 Beverages Lakkalikri 1 Beverages Laughing Lumberjack Lager 7 Produce Longlife Tofu 2 Condiments Louisiana Fiery Hot Pepper Sauce Condiments Louisiana Hot Sniced Okra 7 Produce Manjimup Dried Apples ProductSales 14,123.85 1,544.00 9,796.33 22,413.48 14,525.00 5,070.60 5,817.80 2,295.90 5,214.88 917.62 1,282.01 51,569.58 2,913.68 2,058.00 10,433.94 906.00 1,474.82 30,088.40 7,188,49 2,500.00 629.20 1,571.62 14,041.80 6,543.43 11,225.65 4,023.60 8,720.30 6,397.11 10,034.90 4,322.72 941.34 7,883.10 868.00 1,186.00 8,117.88 2,108.00 16,024.02 Beverages 1 Beverages Laughing Lumberjack Lager 7 Produce Longlife Tofu 2 Condiments Louisiana Fiery Hot Pepper Sauce 2 Condiments Louisiana Hot Spiced Okra 7 Produce Manjimup Dried Apples 4 Dairy Products Mascarpone Fabioli 3 Confections Maxilaku 6 Meat/Poultry Mishi Kobe Niku 4 Dairy Products Mozzarella di Giovanni 8 Seafood Nord-Ost Matjeshering 2 Condiments Northwoods Cranberry Sauce 3 Confections NuNuCa Nu-Nougat-Creme 2 Condiments Original Frankfurter grne Soe 1 Beverages Outback Lager 6 Meat/Poultry Pt chinois 3 Confections Pavlova 6 Meat/Poultry Perth Pasties 4 Dairy Products Queso Cabrales 4 Dairy Products Queso Manchego La Pastora 4 Dairy Products Raclette Courdavault 5 Grains/Cereals Ravioli Angelo 1 Beverages Rhnbru Klosterbier 8 Seafood Rd Kaviar 8 Seafood Rgede sild 7 Produce Rssle Sauerkraut 1 Beverages Sasquatch Ale 3 Confections Schoggi Schokolade 3 Confections Scottish Longbreads 5 Grains/Cereals Singaporean Hokkien Fried Mee 3 Confections Sir Rodney's Marmalade 3 Confections Sir Rodney's Scones 2 Condiments Sirop d'rable 8 Seafood Spegesild 1 Beverages Steeleye Stout 3 Confections Tarte au sucre 3 Confections Teatime Chocolate Biscuits 6 Meat/Poultry Thringer Rostbratwurst 7 Produce Tofu WILLY Tourter 7,883. IU 868.00 1,186.00 8,117.88 2,108.00 16,024.02 2,668.80 3,060.60 6,935.50 12,427.38 5,573.62 3,300.00 1,058.40 4,711.98 5,663.40 9,114.48 7,180.15 13,832.13 5,310.69 8,335.30 32,769.55 2,156.70 3,670.24 3,517.50 3,203.40 13,691.48 2,079.00 9,218.00 3,909.00 4,996.60 9,711.90 4,941.00 8,521.50 3,655.32 5,955.30 20,811.32 2,339.99 30,038.43 6,820.38 3,120.36 8 Seafood Spegesild 1 Beverages Steeleye Stout 3 Confections Tarte au sucre 3 Confections Teatime Chocolate Biscuits 6 Meat/Poultry Thringer Rostbratwurst 7 Produce Tofu 6 Meat/Poultry Tourtire 5 Grains/Cereals Tunnbrd 7 Produce Uncle Bob's Organic Dried Pears 3 Confections Valkoinen suklaa 2 Condiments Vegie-spread 5 Grains/Cereals Wimmers gute Semmelkndel 3 Confections Zaanse koeken 3,655.32 5,955.30 20,811.32 2,339.99 30,038.43 6,820.38 3,120.36 2,576.70 8,251.80 2,368.44 6,087.69 7,923.47 2,645.75 DATE COMNAM TICKER 31/01/2007 APPLE INC AAPL 28/02/2007 APPLE INC AAPL 30/03/2007 APPLE INC AAPL 30/04/2007 APPLE INC AAPL 31/05/200: APPLE INC AAPL 29/06/200: APPLE INC AAPL vwretd RET 0.019428 0.01049 -0.01396 -0.01306 0.012949 0.098097 0.039821 0.074158 0.038932 0.214339 -0.01476 0.007005 31/08/200: APPLE INC AAPI nn11656 051002 DATE COMNAM TICKER 31/01/200.APPLE INC AAPL 28/02/200.APPLE INC AAPL 30/03/200.APPLE INC AAPL 30/04/200: APPLE INC AAPL 31/05/200: APPLE INC AAPL 29/06/200 APPLE INC AAPL 31/07/200 APPLE INC AAPL 31/08/200: APPLE INC AAPL 28/09/200 APPLE INC AAPL 31/10/200 APPLE INC AAPL 30/11/200 APPLE INC AAPL 31/12/200.APPLE INC AAPL 31/01/200F APPLE INC AAPL 29/02/200E APPLE INC AAPL 31/03/200E APPLE INC AAPL 30/04/2001 APPLE INC AAPL 30/05/2004 APPLE INC AAPL 30/06/200F APPLE INC AAPL 31/07/2001 APPLE INC AAPL 29/08/2008 APPLE INC AAPL 30/09/2008 APPLE INC AAPL 31/10/200E APPLE INC AAPL 28/11/2008 APPLE INC AAPL 31/12/200F APPLE INC AAPL 30/01/2008 APPLE INC AAPL 27/02/200: APPLE INC AAPL 31/03/200: APPLE INC AAPL 30/04/2005 APPLE INC AAPL 29/05/2005 APPLE INC AAPL 30/06/200: APPLE INC AAPL 31/07/2008 APPLE INC AAPL 31/08/2004 APPLE INC AAPL 30/09/2005 APPLE INC AAPL 30/10/2008 APPLE INC AAPL 30/11/200APPLE INC AAPL 31/12/2005 APPLE INC AAPL 29/01/201C APPLE INC AAPL 26/02/2017 APPLE INC AAPL 31/03/2010 APPLE INC AAPL 30/04/2016 APPLE INC AAPL 28/05/2011 APPLE INC AAPL 30/06/2017 APPLE INC AAPL 30/07/2016 APPLE INC AAPL 31/08/2010 APPLE INC AAPL 30/09/2010 APPLE INC AAPL 29/10/201C APPLE INC AAPL 30/11/2016 APPLE INC AAPL 31/12/2016 APPLE INC AAPL 31/01/2018 APPLE INC AAPL 28/02/201: APPLE INC AAPL 31/03/201: APPLE INC AAPL 29/04/2011 APPLE INC AAPL 31/05/2013 APPLE INC AAPL 30/06/2011 APPLE INC AAPL 29/07/2011 APPLE INC AAPL 31/08/2011 APPLE INC AAPL 30/09/2011 APPLE INC AAPL 31/10/2011 APPLE INC AAPL 30/11/2011 APPLE INC AAPL 30/12/2011 APPLE INC AAPL wwred RET 0.019428 0.01049 -0.01396 0.01306 0.012949 0.098097 0.039821 0.074158 0.038932 0.214339 -0.01476 0.007005 -0.03176 0.079646 0.011656 0.051002 0.04086 0.108247 0.025835 0.237701 -0.04922 -0.0407 -0.00442 0.087038 -0.06215031664 -0.02165 0.07639 -0.01042 0.147816 0.051105 0212195 0.023843 0.085062 -0.07843 -0.1129 -0.01333 -0.05071 0.010564 0.066562 -0.09801 -0.32956 -0.1846 -0.05341 -0.08462 0.13868 0.022149 0.07899 -0.07733 0.05600 -0.10018 00091 0.086693 0.177024 0.109359 0.197013 0.067789 0.079313 -0.0031 0.048745 0.081718 0.14716 0.031466 0.0295 0.045235 0.101896 -0.028 0.016995 0.057099 0.060531 0.028419 0.054134 -0.0371 -0.08859 0.034775 0.06538 0.063605 0.14847 0.020011 0111021 -0.07914 0.01613 -0.05072 -0.02083 0.071554 0.022741 -0.04282 0.05501 0.091518 0.167215 0.038532 0.060723 0.005165 0.03379 0.067152 0.03667 0.019157 0.051959 0.038164 0.040935 0.003374 -0.01331 0.028689 0.004656 -0.01493 -0.00657 -0.0184 0.03496 -0.02247 0163285 -0.05747 -0.01447 -0.08487 -0.00912 0.113984 0.061523 -0.00623 -0.05578 0.003701 0.059655 Question 1 1 pts What is the cell contents (not the value, what shows in the formula bar) of cell A2 on the Paste Link tab? Be specific, include all punctuation, if applicable
Step by Step Solution
There are 3 Steps involved in it

Get step-by-step solutions from verified subject matter experts