

Question: Three data variables were saved in 3 R objects named x1, x2, and x3, respectively. The results of the summary() function with each variable as
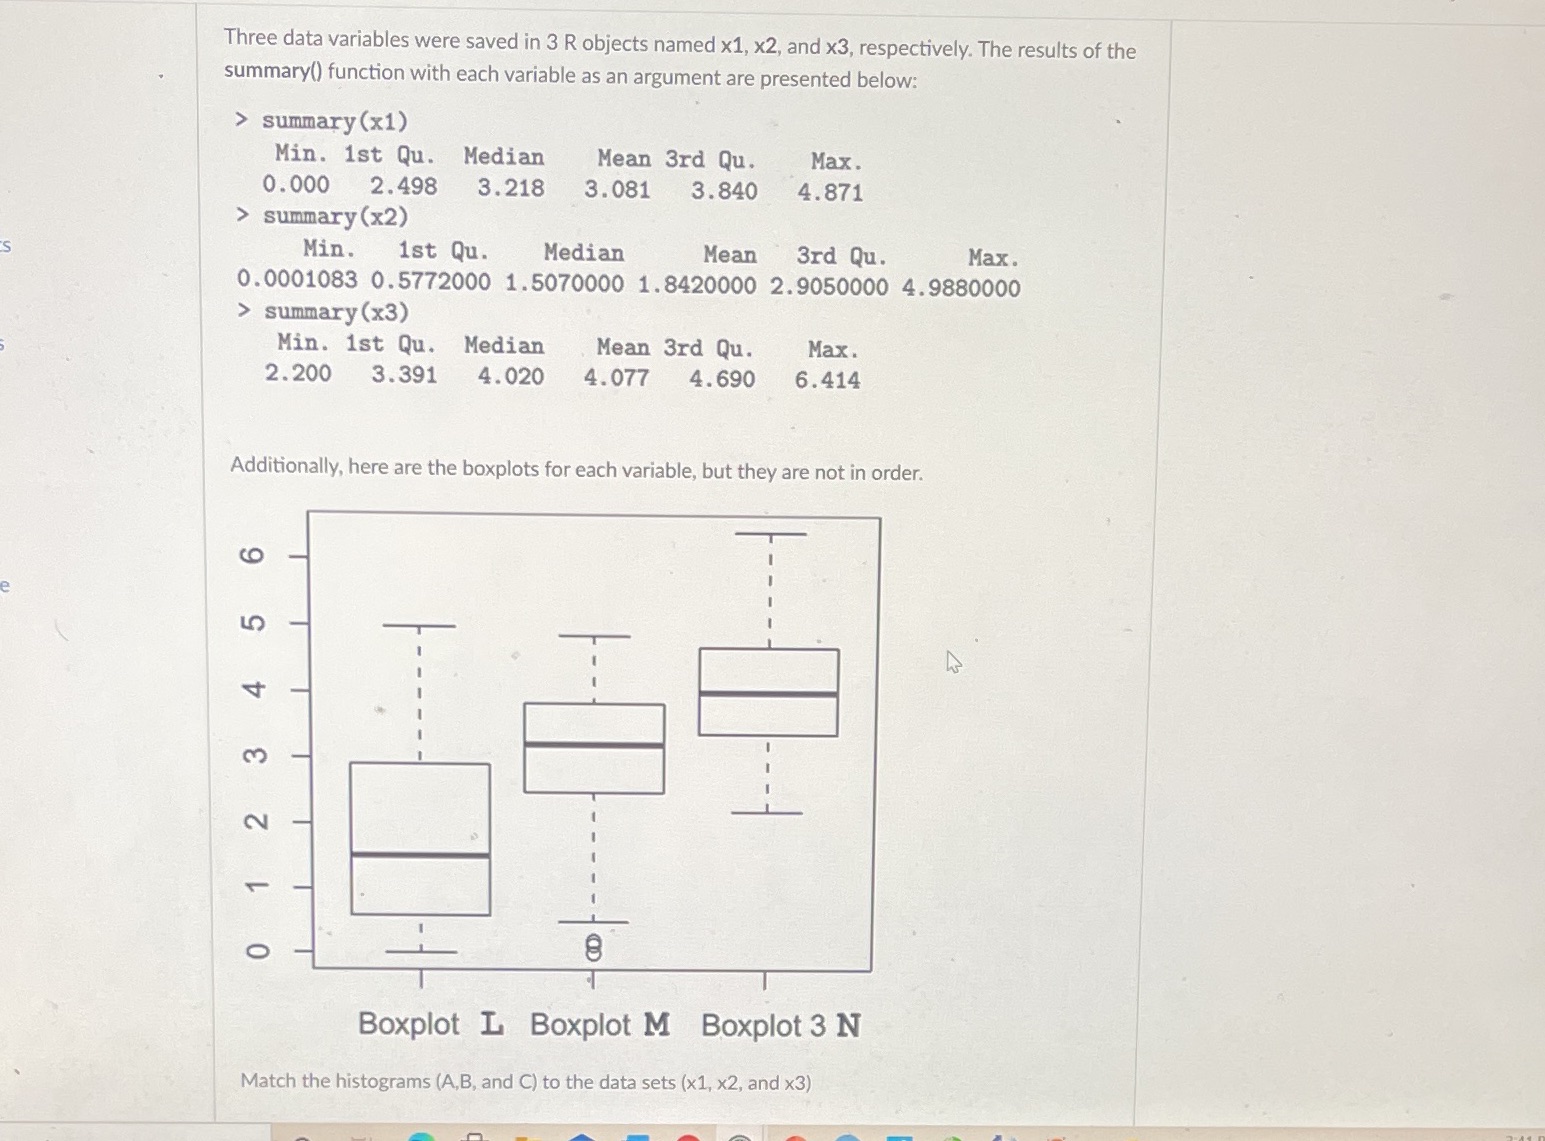
Three data variables were saved in 3 R objects named x1, x2, and x3, respectively. The results of the summary() function with each variable as an argument are presented below: > summary (x1) Min. ist Qu. Median Mean 3rd Qu. Max. 0.000 2.498 3.218 3.081 3.840 4.871 > summary (x2) Min. ist Qu. Median Mean 3rd Qu. Max. 0. 0001083 0.5772000 1. 5070000 1. 8420000 2.9050000 4. 9880000 > summary (x3) Min. ist Qu. Median Mean 3rd Qu. Max. 2.200 3.391 4.020 4.077 4. 690 6.414 Additionally, here are the boxplots for each variable, but they are not in order. to LO + O 8 Boxplot L Boxplot M Boxplot 3 N Match the histograms (A,B, and C) to the data sets (x1, x2, and x3)
Step by Step Solution
There are 3 Steps involved in it

Get step-by-step solutions from verified subject matter experts