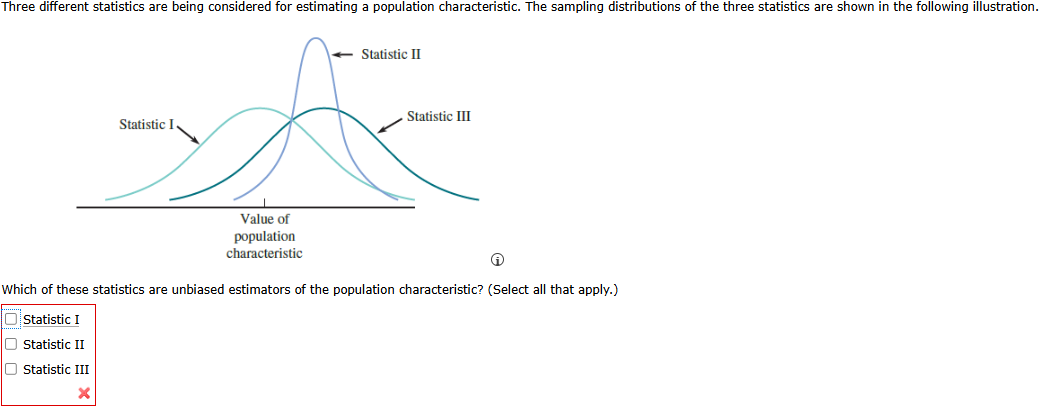
Question: Three different statistics are being considered for estimating a population characteristic. The sampling distributions of the three statistics are shown in the following illustration. Statistic

Three different statistics are being consideredThree different statistics are being consideredThree different statistics are being consideredThree different statistics are being considered
Three different statistics are being considered for estimating a population characteristic. The sampling distributions of the three statistics are shown in the following illustration. Statistic II Statistic III Statistic I Value of population characteristic Which of these statistics are unbiased estimators of the population characteristic? (Select all that apply.) Statistic I O Statistic II O Statistic III XGreat let's take a closer, step-by-step look at the image to correctly identify which statistics are unbiased estimators. __ Step-by-Step Analysis |) Step 1: What is an Unbiased Estimator? An unbiased estimator is one whose sampling distribution has its mean (center) exactly at the true population value. e Visually, this means the peak (center) of the curve should align with the true population characteristic, as shown on the horizontal axis. a) Step 2: Examine the Sampling Distributions in the Image e The value of the population characteristic is marked by a vertical line in the center of the graph. e There are three bell-shaped curves representing the sampling distributions of: Statistic | (left curve, wider) * Statistic Il (center curve, narrow and peaked) e Statistic Ill (right curve) Let's determine where each distribution is centered relative to the population value: } Statistic |: e The peak of the curve aligns with the population characteristic. | Unbiased Statistic Il: e Also centered exactly at the population characteristic. e |. Unbiased } Statistic III: e The curve is shifted to the right of the population characteristic. e Biased Step 3: Interpretation Only Statistic | and Statistic Il are centered at the true population value, so they are unbiased. Statistic Ill is not centered at the population value, so it is biased. | Final Correct Answer: @Statistic! Qj Statistic ll e [ | Statistic Ill | Correct unbiased estimators: Statistic | and Statistic Il Original Selection in Image: The image shows only Statistic | was selected, which is incorrect by itself. That's why a red 9 is shown

Step by Step Solution

There are 3 Steps involved in it

1 Expert Approved Answer
Step: 1 Unlock blur-text-image
Question Has Been Solved by an Expert!

Get step-by-step solutions from verified subject matter experts

Step: 2 Unlock
Step: 3 Unlock

Students Have Also Explored These Related Accounting Questions!