

Question: Three irrigators sharing a water source have the following marginal net benefit q3 - Microsoft Word - X Home Insert Page Layout References Mailings Review
Three irrigators sharing a water source have the following marginal net benefit
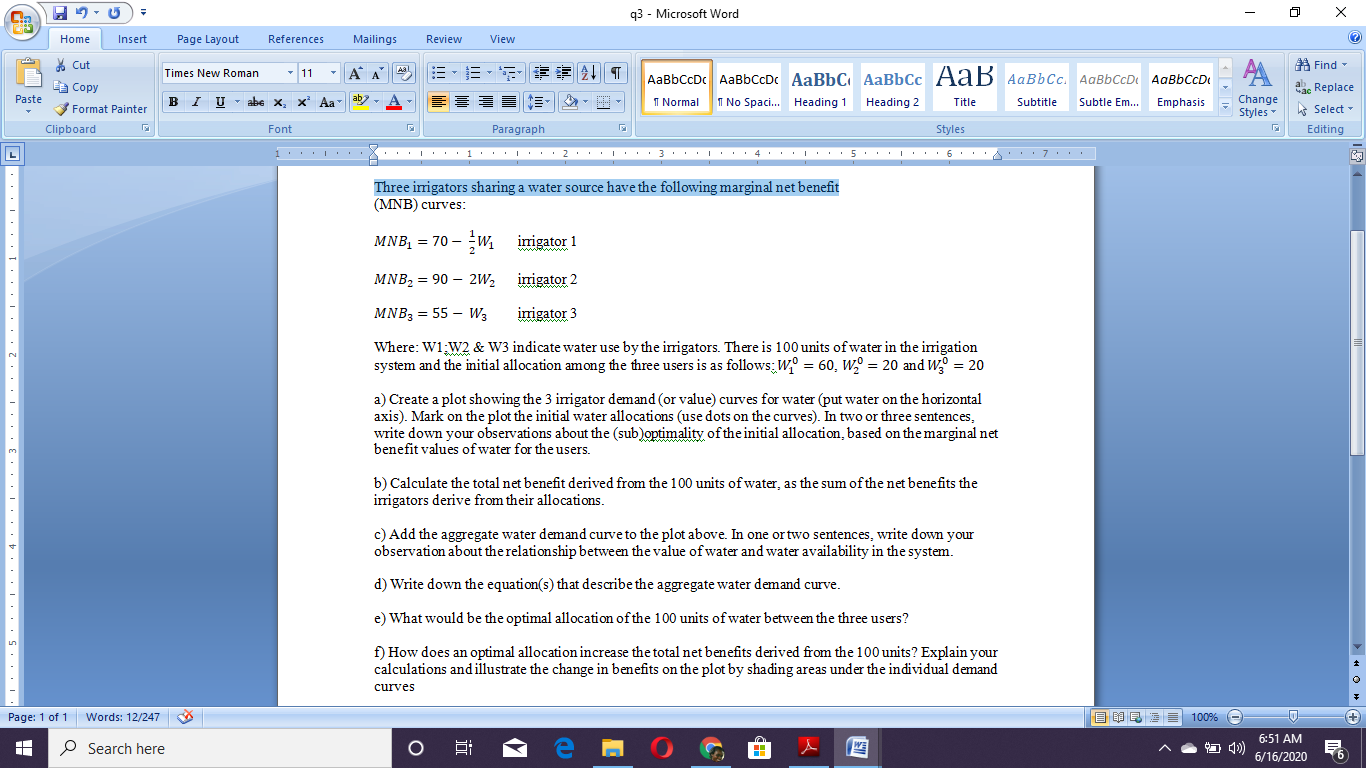
q3 - Microsoft Word - X Home Insert Page Layout References Mailings Review View * Cut Times New Roman En Copy + 11 - A A 43 AaBbCcDC AaBbCcDC AaBbC AaBbCc AaB AaBbCc. AaBbCCD AaBbCCD AA #Find Paste Format Painter 1 Normal 1 No Spaci... Heading 1 Heading 2 Title Subtle Em... Emphasis Change Gac Replace B I U - abe X2 X' Aa ab - A- Subtitle Styles . Select Clipboard Font Paragraph Styles Editing Three irrigators sharing a water source have the following marginal net benefit (MNB) curves: MNB1 = 70 - =WI irrigator 1 MNB2 = 90 - 2W2 irrigator 2 MNB3 = 55 - W3 inigator 3 Where: W1;W2 & W3 indicate water use by the irrigators. There is 100 units of water in the irrigation system and the initial allocation among the three users is as follows: W = 60, W = 20 and W;" = 20 a) Create a plot showing the 3 irrigator demand (or value) curves for water (put water on the horizontal axis). Mark on the plot the initial water allocations (use dots on the curves). In two or three sentences, write down your observations about the (sub )optimality of the initial allocation, based on the marginal net benefit values of water for the users. b) Calculate the total net benefit derived from the 100 units of water, as the sum of the net benefits the irrigators derive from their allocations. c) Add the aggregate water demand curve to the plot above. In one or two sentences, write down your observation about the relationship between the value of water and water availability in the system. d) Write down the equation(s) that describe the aggregate water demand curve. e) What would be the optimal allocation of the 100 units of water between the three users? f) How does an optimal allocation increase the total net benefits derived from the 100 units? Explain your calculations and illustrate the change in benefits on the plot by shading areas under the individual demand curves Page: 1 of 1 Words: 12/247 1 = 100% + H Search here O emo A 6:51 AM 6/16/2020
Step by Step Solution
There are 3 Steps involved in it

Get step-by-step solutions from verified subject matter experts