

Question: Through R language After (b) Problem 1 (a) Obtain time series of real GDP and real consumption for a country of your choice. Provide details.
Through R language
After (b)
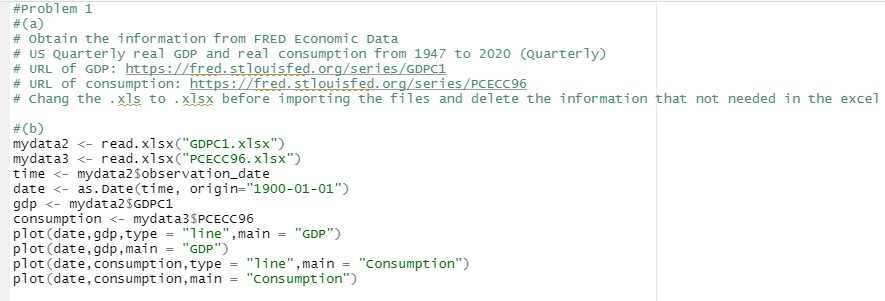
Problem 1 (a) Obtain time series of real GDP and real consumption for a country of your choice. Provide details. (b) Display time-series plots and a scatterplot (put consumption on the vertical axis). (c) Convert your series to growth rates in percent, and again display time series plots. (d) For each series, ,provide summary statistics (e.g., mean, standard deviation, range, skewness, kurtosis, (e) Run a simple OLS linear regression in R and interpret its coefficient estimates. (f) Interpret goodness-of-fit metrics for OLS linear regression. (g) Relate R2 with correlation coefficient.#problem 1 # (a) # obtain the information from FRED Economic Data # US Quarterly real GDP and real consumption from 1947 to 2020 (Quarterly) # URL of GDP: https : //fred. stlouisfed. org/series/GDPC1 # URL of consumption: https : //fred. stlouisfed. org/series/PCECC96 # Chang the . xIs to . x]sx before importing the files and delete the information that not needed in the excel # (b) mydata2
Step by Step Solution
There are 3 Steps involved in it

Get step-by-step solutions from verified subject matter experts