

Question: Throx sells higher-end custom-design socks in three-sock sets (rather than two). The company operates from a small packaging and distribution facility in Richmond, CA from
Throx sells higher-end custom-design socks in three-sock sets (rather than two). The company operates from a small packaging and distribution facility in Richmond, CA from which it ships product to customers. Given the companys location and focus, 97% of sales are in California, primarily in the major urban areas of the San Francisco bay area, Los Angeles, Sacramento (and last but not least) San Diego. The company sells exclusively via online sales, at an average price of $18/three-sock set, plus shipping costs charged to the customer.
The company currently orders its product from the Chinese sock manufacturer Zhejiang Datang Hosiery Group Co., Ltd in so-called Sock City. Socks are shipped via truck to the port of Shanghai, from where they are shipped to the port at Los Angeles-Long Beach via ocean freight. Once offloaded in Los Angeles-Long Beach, the socks are shipped via truck to the Richmond facility. On average, shipment from the manufacturer to the Richmond facility takes 4 weeks. In addition to the transit time required for shipment, the lead time from when an order is placed with the manufacturer to when it is shipped from Zhejiang is 3 weeks. So, the total lead time is considered to be 7 weeks from when Throx places an order until it reaches the Richmond facility. Historically, the standard deviation of lead time has been 1 week.
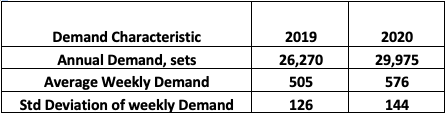
The company provides you with the following information for the past two fiscal years:
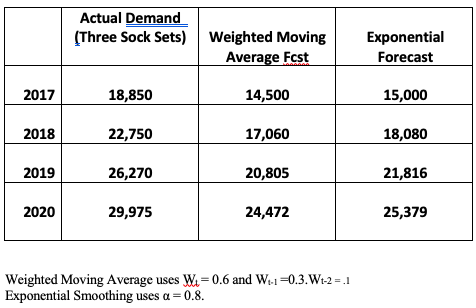
Throx uses two main forecasting methods based on annual data to predict orders for the following year, a weighted moving average and exponential smoothing. They provide you with the following information about forecasts for FY 2017 through FY2020:
The initial inventory for all sock styles combined at the beginning of FY 2021 is 2,250 units. You also have information on current costs, which includes:
- Order cost to Throx for an order placed with its current supplier, $/order = S = $225
- Holding cost per set per per year = H = $1.75
- The company currently pays $6.80 for each set of socks. = P
The company uses a continuous review replenishment policy, and has IT systems in place that allow constant monitoring of key information. Last year, the company used an ROP under this policy of 1,900 units for all sock styles and an order quantity Q of 4,500 units for all sock styles.
1. Calculate measures of forecast accuracy: MFE, MAD and MAPE using the data from FY2019 and FY2020. Which forecast is more accurate? Do these forecasts seem adequate for the purposes of decision making? Why or why not?
Demand Characteristic Annual Demand, sets Average Weekly Demand Std Deviation of weekly Demand 2019 26,270 505 126 2020 29,975 576 144 Actual Demand (Three Sock Sets) Weighted Moving Average Fcst Exponential Forecast 2017 18,850 14,500 15,000 2018 22,750 17,060 18,080 2019 26,270 20,805 21,816 2020 29,975 24,472 25,379 Weighted Moving Average uses W=0.6 and W-1=0.3. Wt-2.1 Exponential Smoothing uses a=0.8Step by Step Solution
There are 3 Steps involved in it

Get step-by-step solutions from verified subject matter experts