

Question: THUMBS UP UPON SOLVING! PLEASE MAKE A VERY DETAILED/DESCRIPTIVE ANSWER! THANK YOU!! This company has come to you, a private investor, requesting a loan of
THUMBS UP UPON SOLVING! PLEASE MAKE A VERY DETAILED/DESCRIPTIVE ANSWER! THANK YOU!!
This company has come to you, a private investor, requesting a loan of $10,000,000. They evaluated their product lines and decided to discontinue the one that had exceptionally low margins. It was determined during the analysis that the product line could not meet the rate of return the company has established as the minimum rate of return. Because the financial statements are reflecting such dramatic changes between the two years, their bank is reluctant to make the loan in spite of the higher profit margins and net income. The result of discontinuing the line sales dropped dramatically from the prior year. But their gross margin and net profit as a percent of sales increased over the prior year. The loan proceeds will be used to retool their existing production process to increase capacity to match demand for the new product. They also need working capital to promote the remaining product line. Their business plan calls for expanding the territory to sell their product. Additionally, they are looking at possible replacements of discontinued product line. Based on test market data, the new product line sales will match or exceed the sales of the discontinued line within a short time. So, looking at the financial statements and the ratios and statistics your job is to make an analysis and determine if you will loan the company $10,000,000. So, reviewing the information and statistics, will you loan them the $10,000,000 of your money to help them succeed? Use the area available on the Your Decision tab to answer. Support your answer with your reasoning. Also indicate any questions you would like to ask of the company management to help clarify the loan request.
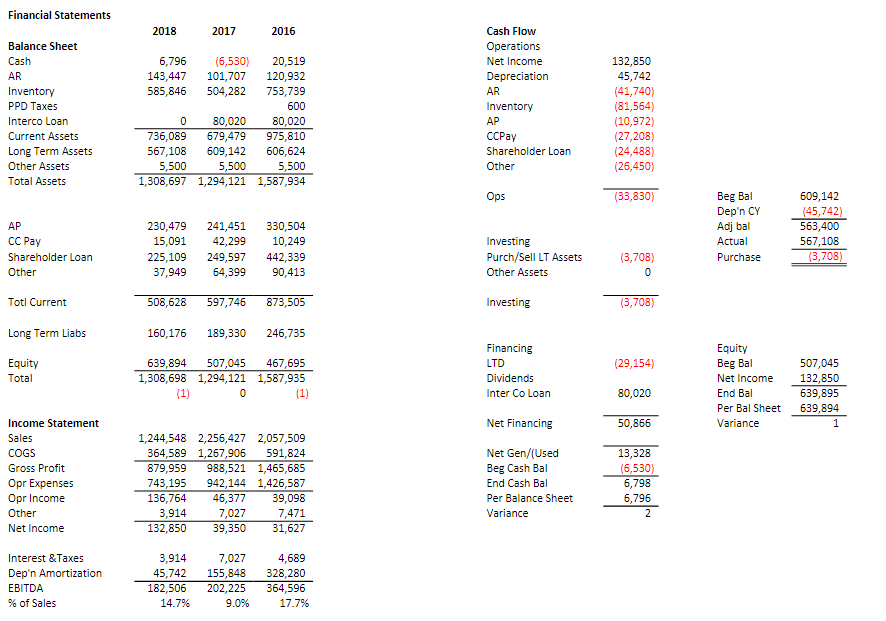
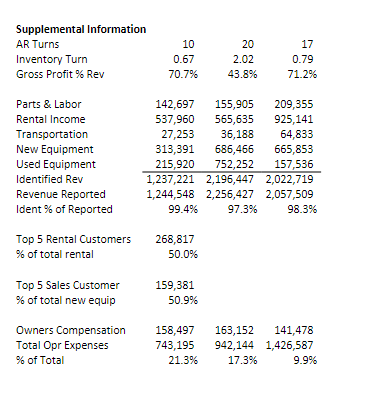
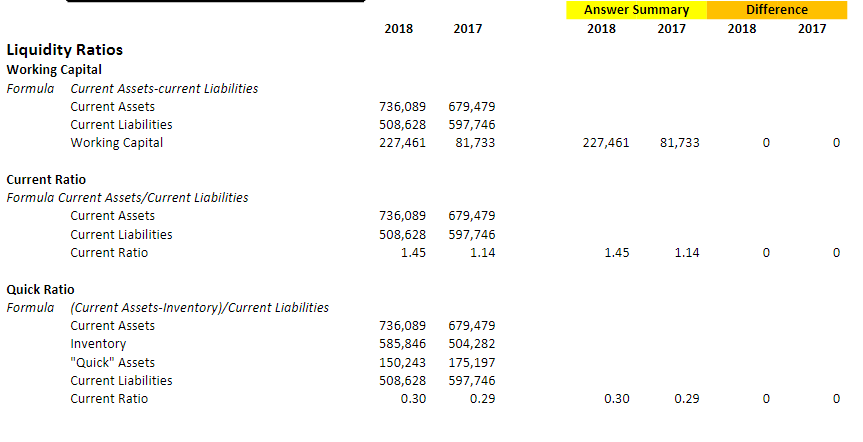
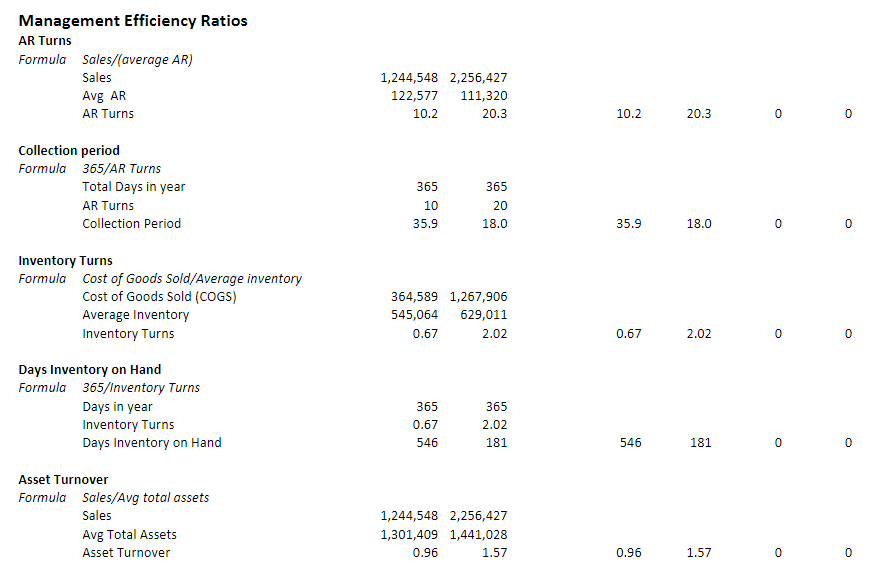
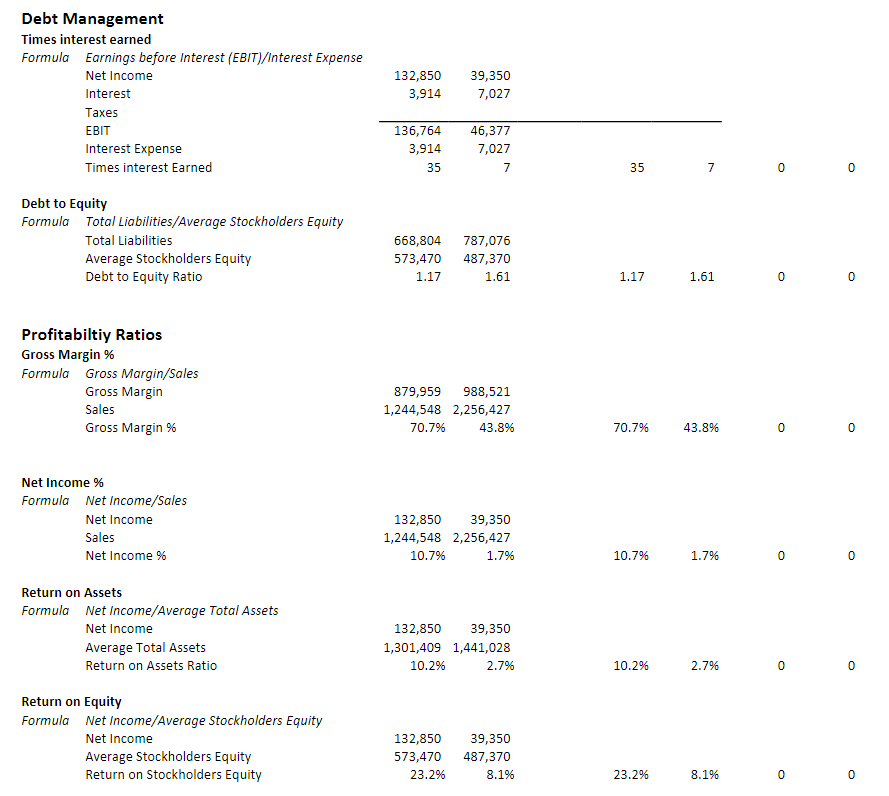
Financial Statements Supplemental Information ARTurnsInventoryTurnGrossProfit%Rev100.6770.7%202.0243.8%170.7971.2% \begin{tabular}{lrrr} Parts \& Labor & 142,697 & 155,905 & 209,355 \\ Rental Income & 537,960 & 565,635 & 925,141 \\ Transportation & 27,253 & 36,188 & 64,833 \\ New Equipment & 313,391 & 686,466 & 665,853 \\ Used Equipment & 215,920 & 752,252 & 157,536 \\ \cline { 2 - 4 } Identified Rev & 1,237,221 & 2,196,447 & 2,022,719 \\ Revenue Reported & 1,244,548 & 2,256,427 & 2,057,509 \\ Ident \% of Reported & 99.4% & 97.3% & 98.3% \end{tabular} Top 5 Rental Customers 268,817 % of total rental 50.0% Top 5 Sales Customer 159,381 % of total new equip 50.9% Owners Compensation 158,497163,152141,478 TotalOprExpenses%ofTotal743,19521.3%942,14417.3%1,426,5879.9% Liquidity Ratios Working Capital Formula Current Assets-current Liabilities CurrentAssetsCurrentLiabilities736,089508,628679,479597,746 Current Ratio Formula Current Assets/Current Liabilities Quick Ratio Formula (Current Assets-Inventory)/Current Liabilities Current Assets 736,089679,479 Inventory 585,846504,282 "Quick"Assets150,243175,197 Current Liabilities 508,628597,746 CurrentRatio0.300.290.300.2900 Management Efficiency Ratios AR Turns Formula Sales/(average AR) SalesAvgAR1,244,548122,5772,256,427111,320 AR Turns 10.220.3 10.220.3 0 Collection period Formula 365/AR Turns TotalDaysinyearARTurns365103652035.918.000 Inventory Turns Formula Cost of Goods Sold/Average inventory Cost of Goods Sold (COGS) Average Inventory Inventory Turns 364,589545,0640.671,267,906629,0112.02 0.672.02 0 Days Inventory on Hand Formula 365/Inventory Turns Days in year Inventory Turns Days Inventory on Hand 546181 0 0 Asset Turnover Formula Sales/Avg total assets Sales 1,244,5482,256,427 Avg Total Assets 1,301,4091,441,028 Asset Turnover 0.961.57 0.961.57 0 Debt Management Times interest earned Formula Earnings before Interest (EBIT)/Interest Expense Net Income Interest Taxes EBIT Interest Expense Times interest Earned 0 Debt to Equity Formula Total Liabilities/Average Stockholders Equity Total Liabilities 668,804787,076 Average Stockholders Equity Debt to Equity Ratio 573,4701.17487,3701.61 1.171.61 Profitabiltiy Ratios Gross Margin \% Formula Gross Margin/Sales Gross Margin Sales Gross Margin \% 879,9591,244,54870.7%988,5212,256,42743.8% 70.7%43.8% 0 Net Income \% Formula Net Income/Sales Net Income Sales Net Income \% 132,8501,244,54810.7%39,3502,256,4271.7% 10.7%1.7% 0 Return on Assets Formula Net Income/Average Total Assets Net Income 132,85039,350 Average Total Assets 1,301,4091,441,028 Return on Assets Ratio 10.2%2.7% 10.2%2.7% 0 0 Return on Equity Formula Net Income/Average Stockholders Equity Net Income Average Stockholders Equity Return on Stockholders Equity 132,850573,47023.2%39,350487,3708.1% 23.2% 8.1% 0 Type your answer in this area to state your decision and why/how you arrived at your decsion
Step by Step Solution
There are 3 Steps involved in it

Get step-by-step solutions from verified subject matter experts