

Question: THW rage Layout Formulas Data Review View Help QuickBooks Search Share RS CALCULATING PORTFOLIO RETURNS Stock A 8.00% 1.71% 13.08% Stock B 11.00% 2.67% 16.34%
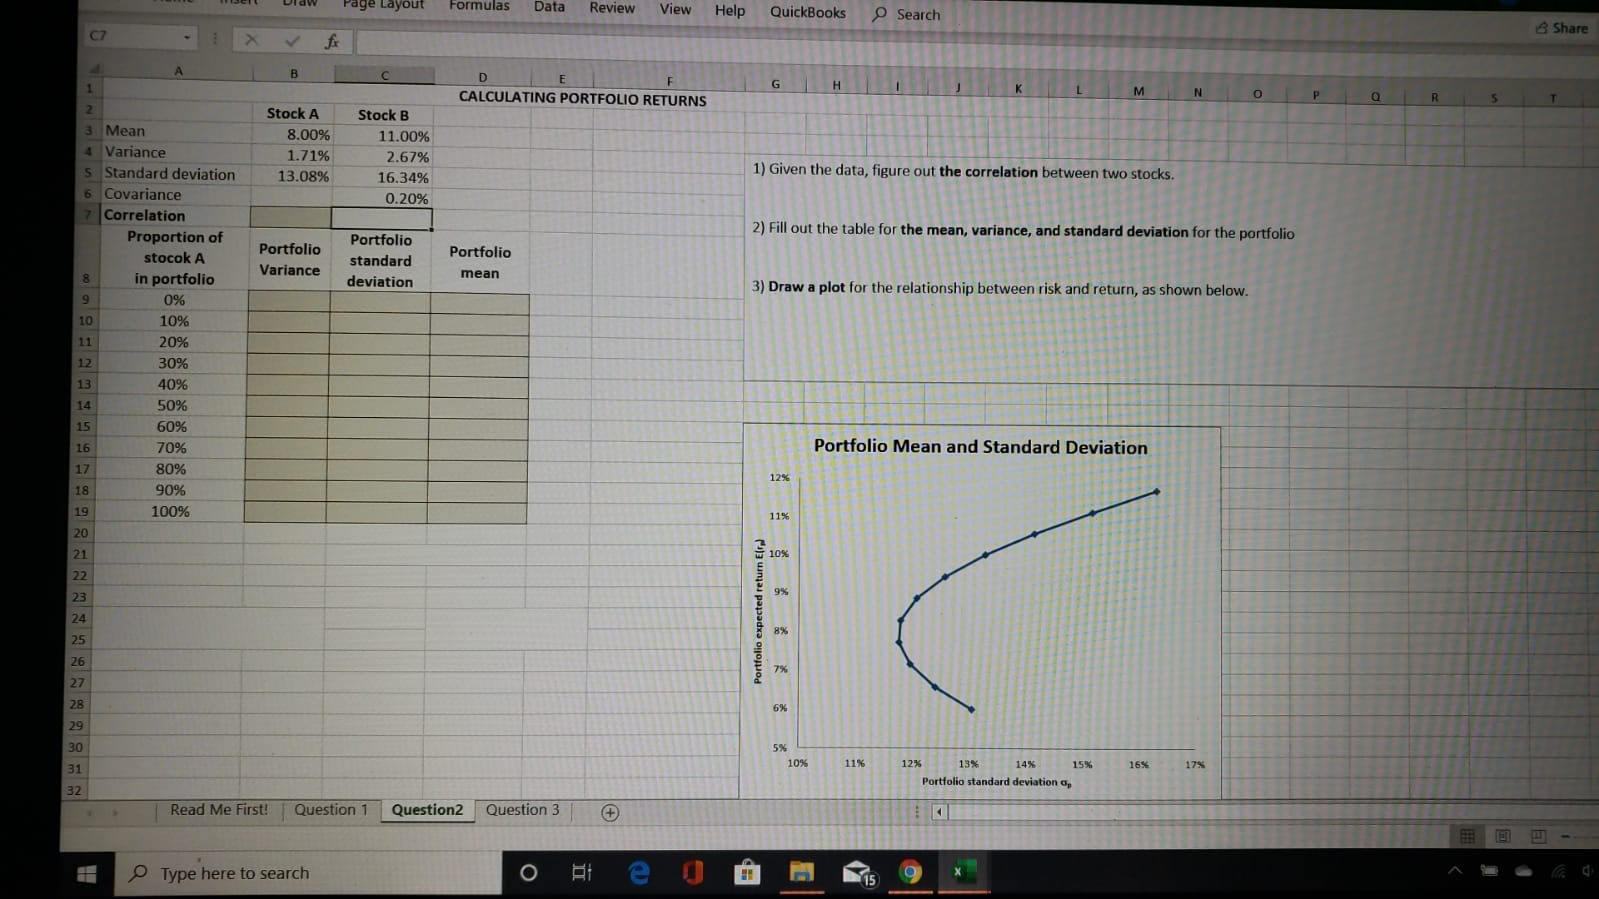
THW rage Layout Formulas Data Review View Help QuickBooks Search Share RS CALCULATING PORTFOLIO RETURNS Stock A 8.00% 1.71% 13.08% Stock B 11.00% 2.67% 16.34% 0.20% 1) Given the data, figure out the correlation between two stocks. 2) Fill out the table for the mean, variance, and standard deviation for the portfolio Portfolio Variance Portfolio standard deviation Portfolio mean 3) Draw a plot for the relationship between risk and return, as shown below. 3 Mean 4 Variance 5 Standard deviation 6 Covariance 7 Correlation Proportion of stocok A in portfolio 0% 10% 20% 30% 40% 50% 60% 70% 80% 90% 100% Portfolio Mean and Standard Deviation Portfolio expected return Eir 16% 17% 13% 14% Portfo olio standard deviation 15% , Read Me First! Question 1 Question2 Question 3 Type here to search THW rage Layout Formulas Data Review View Help QuickBooks Search Share RS CALCULATING PORTFOLIO RETURNS Stock A 8.00% 1.71% 13.08% Stock B 11.00% 2.67% 16.34% 0.20% 1) Given the data, figure out the correlation between two stocks. 2) Fill out the table for the mean, variance, and standard deviation for the portfolio Portfolio Variance Portfolio standard deviation Portfolio mean 3) Draw a plot for the relationship between risk and return, as shown below. 3 Mean 4 Variance 5 Standard deviation 6 Covariance 7 Correlation Proportion of stocok A in portfolio 0% 10% 20% 30% 40% 50% 60% 70% 80% 90% 100% Portfolio Mean and Standard Deviation Portfolio expected return Eir 16% 17% 13% 14% Portfo olio standard deviation 15% , Read Me First! Question 1 Question2 Question 3 Type here to search
Step by Step Solution
There are 3 Steps involved in it

Get step-by-step solutions from verified subject matter experts