

Question: tical program is recommended. er the following time series. table [ [ Quarter , Year 1 , Year 2 , Year 3 ] ,
tical program is recommended.
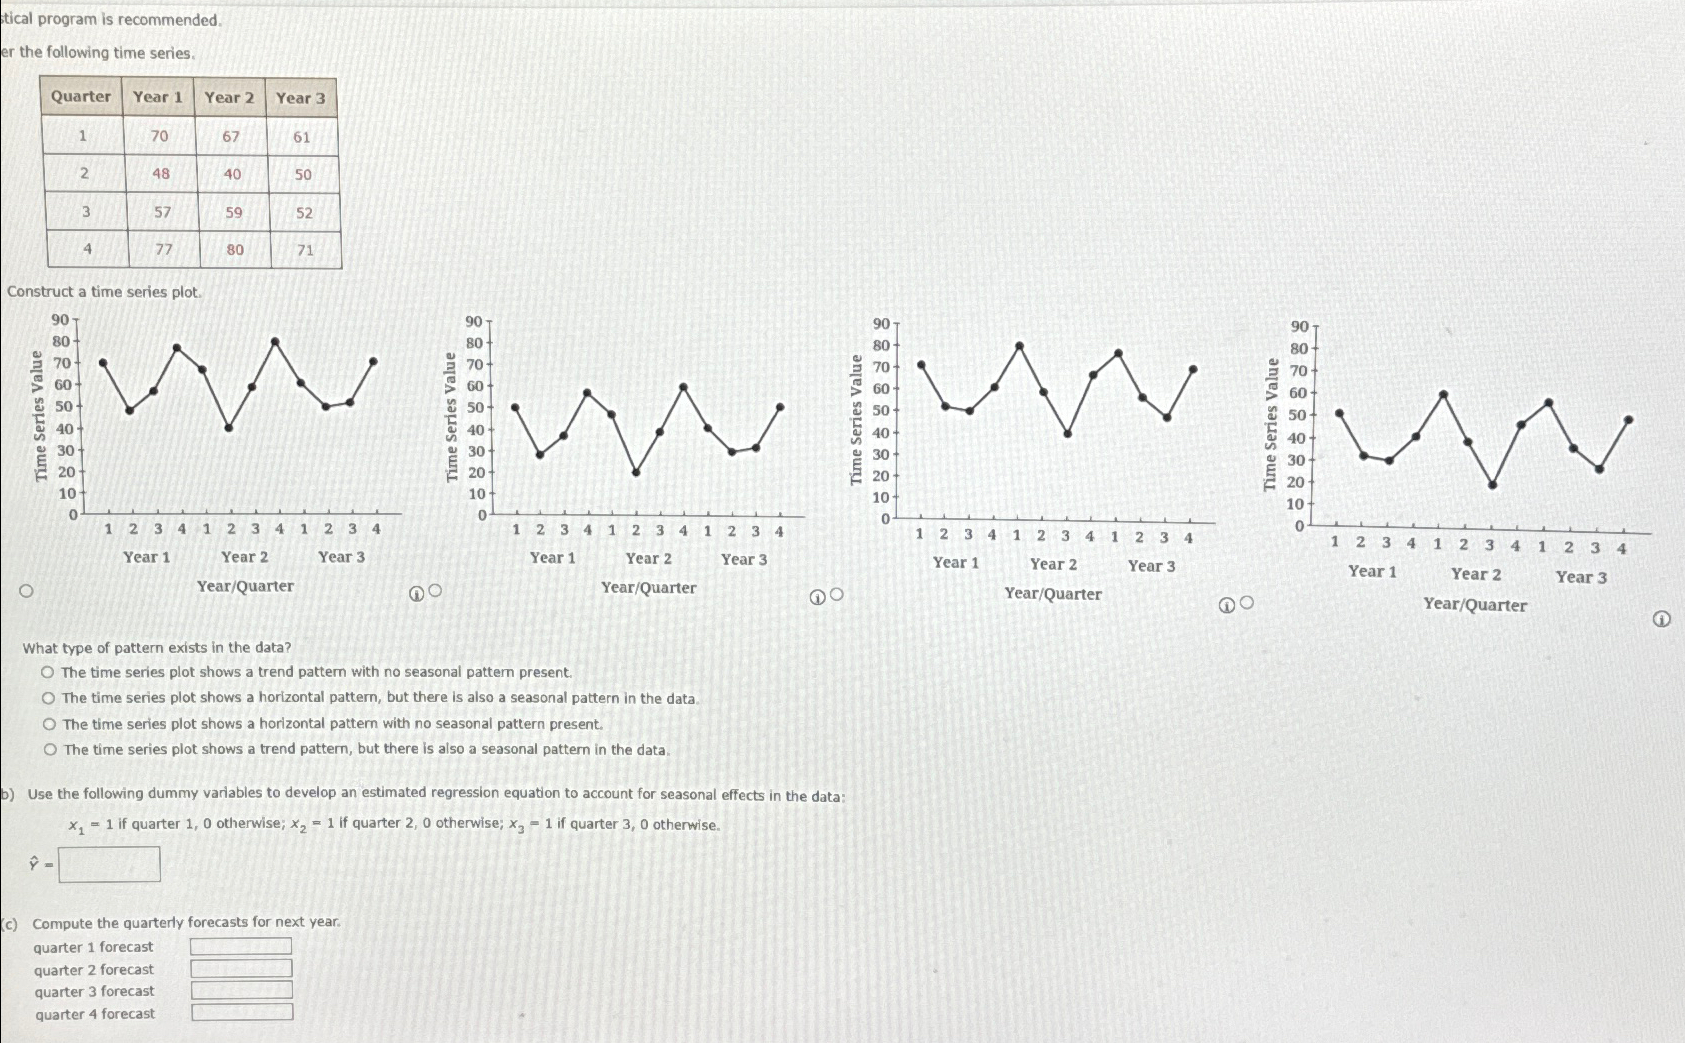
er the following time series.
tableQuarterYear Year Year
Construct a time series plot.
What type of pattern exists in the data?
The time series plot shows a trend pattern with no seasonal pattern present.
The time series plot shows a horizontal pattern, but there is also a seasonal pattern in the data.
The time series plot shows a horizontal pattern with no seasonal pattern present.
The time series plot shows a trend pattern, but there is also a seasonal pattern in the data.
Use the following dummy variables to develop an estimated regression equation to account for seasonal effects in the data:
if quarter otherwise; if quarter otherwise; if quarter otherwise.
hat
c Compute the quarterly forecasts for next year.
quarter forecast
quarter forecast
quarter forecast quarter forecast
Step by Step Solution
There are 3 Steps involved in it
1 Expert Approved Answer
Step: 1 Unlock

Question Has Been Solved by an Expert!
Get step-by-step solutions from verified subject matter experts
Step: 2 Unlock
Step: 3 Unlock