

Question: Time Estimates (Weeks) Activity Predecessor b a 3 e Activity Description Order new machinery b Plan new physical layout Determine safety changes in existing machinery
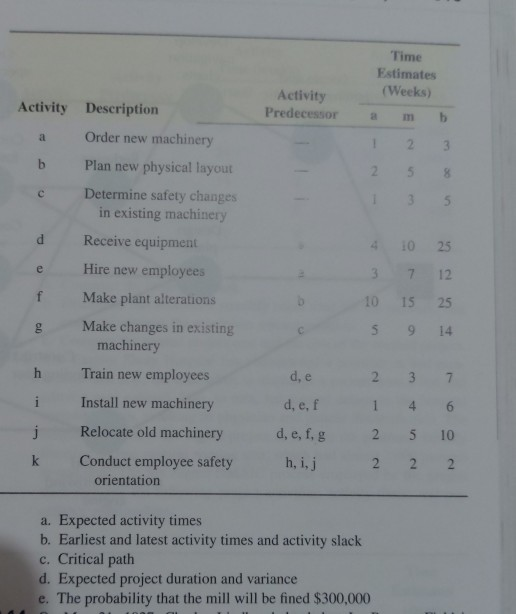
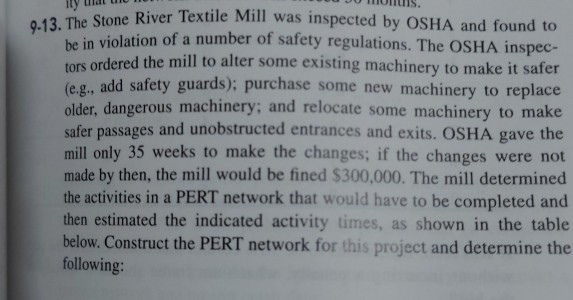
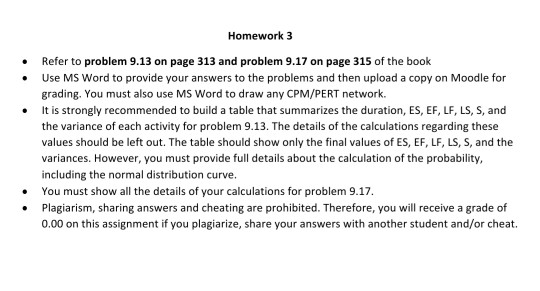
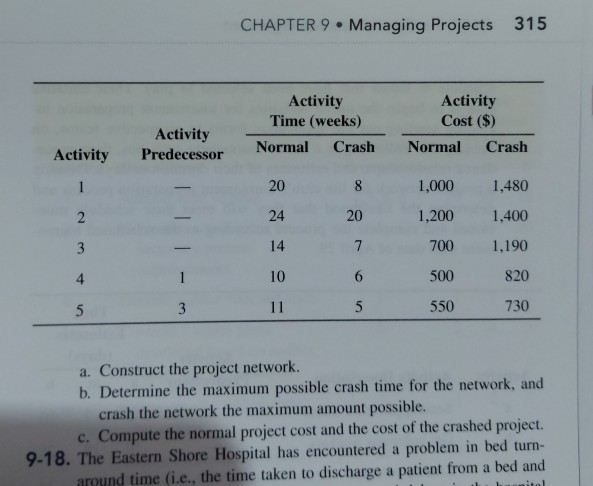
Time Estimates (Weeks) Activity Predecessor b a 3 e Activity Description Order new machinery b Plan new physical layout Determine safety changes in existing machinery d Receive equipment Hire new employees f Make plant alterations Make changes in existing machinery Train new employees Install new machinery j Relocate old machinery k Conduct employee safety orientation 4 10 25 3 7 12 10 15 25 5 9 14 8 d, e 2 3 d, e, f d, e, f, g h, i, j 2 5 10 2 2 2 a. Expected activity times b. Earliest and latest activity times and activity slack c. Critical path d. Expected project duration and variance e. The probability that the mill will be fined $300,000 9.13. The Stone River Textile Mill was inspected by OSHA and found to be in violation of a number of safety regulations. The OSHA inspec- tors ordered the mill to alter some existing machinery to make it safer (e.g., add safety guards); purchase some new machinery to replace older, dangerous machinery, and relocate some machinery to make safer passages and unobstructed entrances and exits. OSHA gave the mill only 35 weeks to make the changes; if the changes were not made by then, the mill would be fined $300,000. The mill determined the activities in a PERT network that would have to be completed and then estimated the indicated activity times, as shown in the table below. Construct the PERT network for this project and determine the following: Homework 3 Refer to problem 9.13 on page 313 and problem 9.17 on page 315 of the book Use MS Word to provide your answers to the problems and then upload a copy on Moodle for grading. You must also use MS Word to draw any CPM/PERT network. It is strongly recommended to build a table that summarizes the duration, ES, EF, LF, LS, S, and the variance of each activity for problem 9.13. The details of the calculations regarding these values should be left out. The table should show only the final values of ES, EF, LF, LS, S, and the variances. However, you must provide full details about the calculation of the probability, including the normal distribution curve. You must show all the details of your calculations for problem 9.17. Plagiarism, sharing answers and cheating are prohibited. Therefore, you will receive a grade of 0.00 on this assignment if you plagiarize, share your answers with another student and/or cheat. . 9.17. The following table provides the information necessary to construct a project network and project crash data: CHAPTER 9. Managing Projects 315 Activity Time (weeks) Normal Crash Activity Cost ($) Normal Crash Activity Predecessor Activity 1 20 8 1,000 1,480 2 24 20 1,200 1,400 3 14 7 700 1,190 4 1 10 6 500 820 5 3 11 5 550 730 a. Construct the project network. b. Determine the maximum possible crash time for the network, and crash the network the maximum amount possible. c. Compute the normal project cost and the cost of the crashed project. 9-18. The Eastern Shore Hospital has encountered a problem in bed turn- around time (i.e., the time taken to discharge a patient from a bed and ital
Step by Step Solution
There are 3 Steps involved in it
1 Expert Approved Answer
Step: 1 Unlock

Question Has Been Solved by an Expert!
Get step-by-step solutions from verified subject matter experts
Step: 2 Unlock
Step: 3 Unlock