

Question: Time le Increase in Demand Decrease in Demand Price Price P* increases P* Decreases Increases Quantity Decreases Quantity (Panel A) (Panel B] Fig. 2
![increases P* Decreases " Increases Quantity Decreases Quantity (Panel A) (Panel B]](https://s3.amazonaws.com/si.experts.images/answers/2024/07/668248f2deee3_386668248f2cdc8c.jpg)
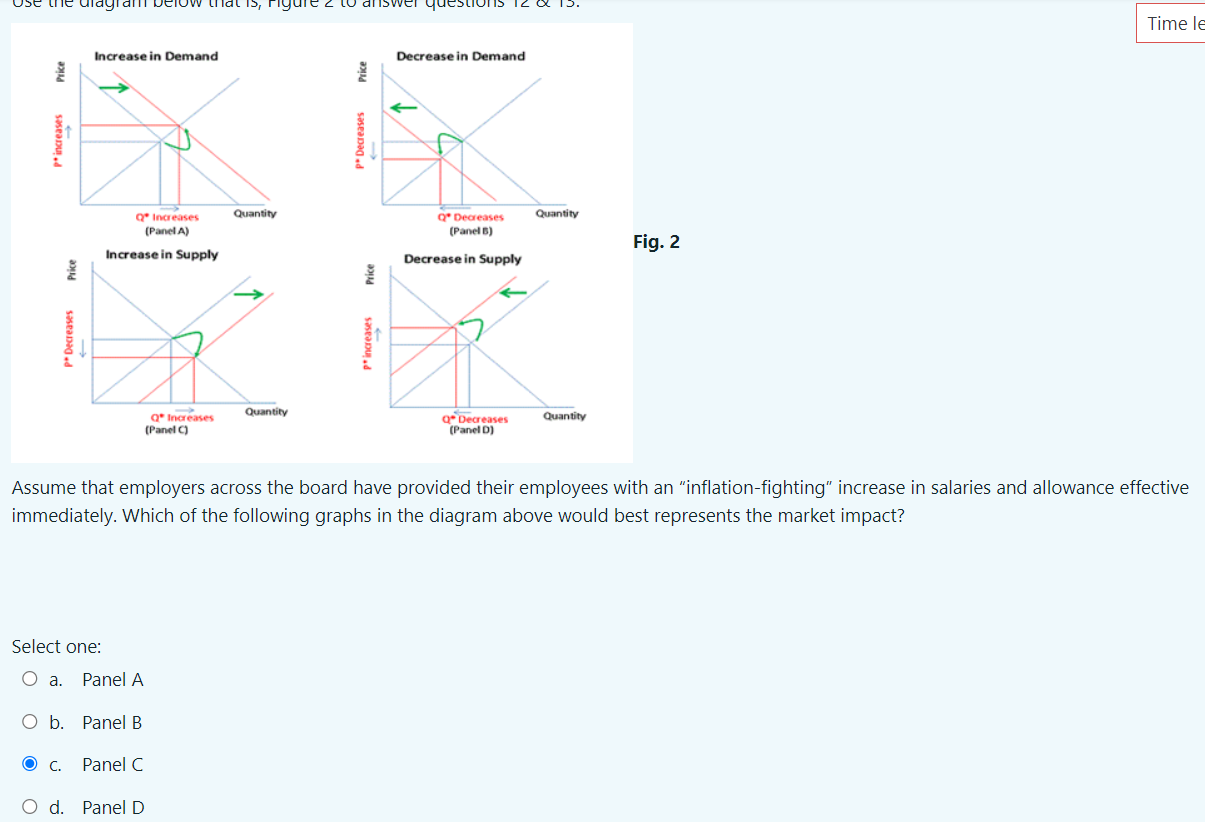
Time le Increase in Demand Decrease in Demand Price Price P* increases P* Decreases " Increases Quantity Decreases Quantity (Panel A) (Panel B] Fig. 2 Increase in Supply Decrease in Supply Price Price P* Decreases P* increases Q' Increases Quantity Q Decreases Quantity (Panel C) (Panel D) Assume that employers across the board have provided their employees with an "inflation-fighting" increase in salaries and allowance effective immediately. Which of the following graphs in the diagram above would best represents the market impact? Select one: O a. Panel A O b. Panel B O c. Panel C O d. Panel DAssume that the agricultural industry is experiencing a severe drought, which of the graphs in the diagram above represents the impact on the supply of agricultural products? Select one: O a. Panel A O b. Panel B O c. Panel C O d. Panel D Clear my choice
Step by Step Solution
There are 3 Steps involved in it

Get step-by-step solutions from verified subject matter experts