

Question: Time left 0:26:33 Question 2 Table 1: Mutually Exclusive Alternatives Not yet answered A B D E Marked out of 20.00 $6,000 $6,500 $8,000 $2,900
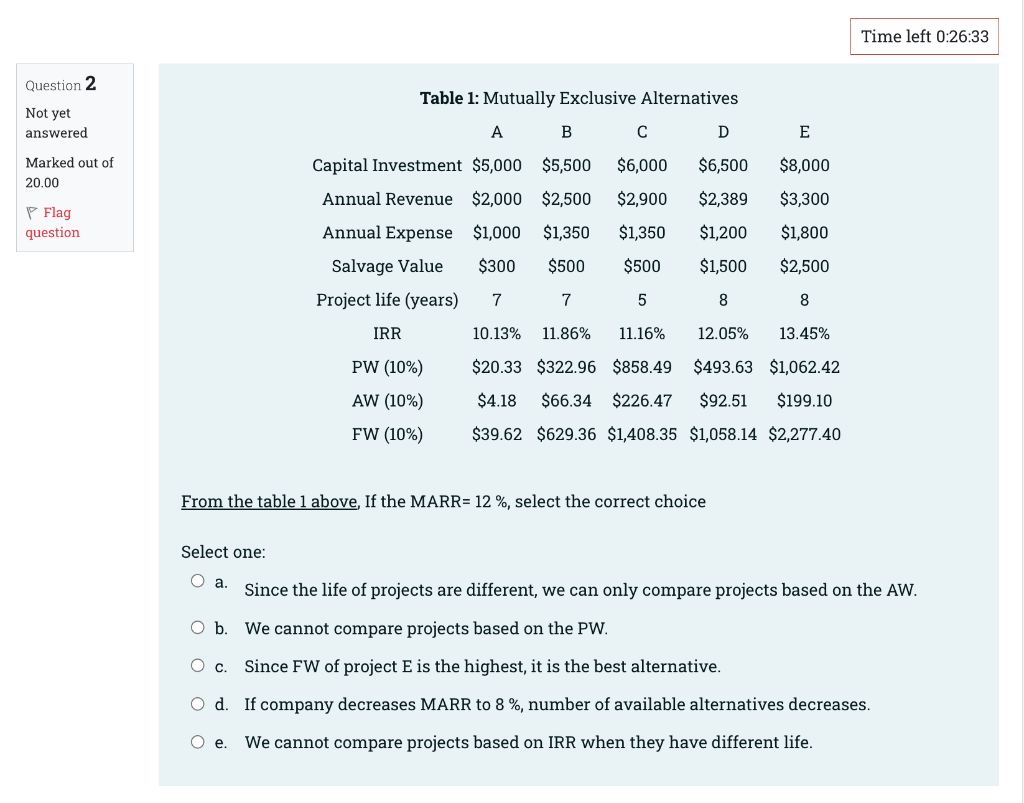
Time left 0:26:33 Question 2 Table 1: Mutually Exclusive Alternatives Not yet answered A B D E Marked out of 20.00 $6,000 $6,500 $8,000 $2,900 $2,389 P Flag Capital Investment $5,000 $5,500 Annual Revenue $2,000 $2,500 Annual Expense $1,000 $1,350 Salvage Value $300 $500 $3,300 $1,800 question $1,350 $1,200 $500 $1,500 $2,500 Project life (years) 7 7 5 8 8 IRR 10.13% 11.86% 11.16% 12.05% 13.45% $20.33 $322.96 $858.49 $493.63 $1,062.42 PW (10%) AW (10%) FW (10%) $4.18 $66.34 $226.47 $92.51 $199.10 $39.62 $629.36 $1,408.35 $1,058.14 $2,277.40 From the table 1 above, If the MARR= 12 %, select the correct choice Select one: O a. Since the life of projects are different, we can only compare projects based on the AW. O b. We cannot compare projects based on the PW. . Since FW of project E is the highest, it is the best alternative. O d. If company decreases MARR to 8 %, number of available alternatives decreases. O e. We cannot compare projects based on IRR when they have different life
Step by Step Solution
There are 3 Steps involved in it

Get step-by-step solutions from verified subject matter experts