

Question: Time series Analysis: all information given is provided. only thing not shown are graph options. would love help and explanation on solving! em Set 4
Time series Analysis:
all information given is provided. only thing not shown are graph options. would love help and explanation on solving!
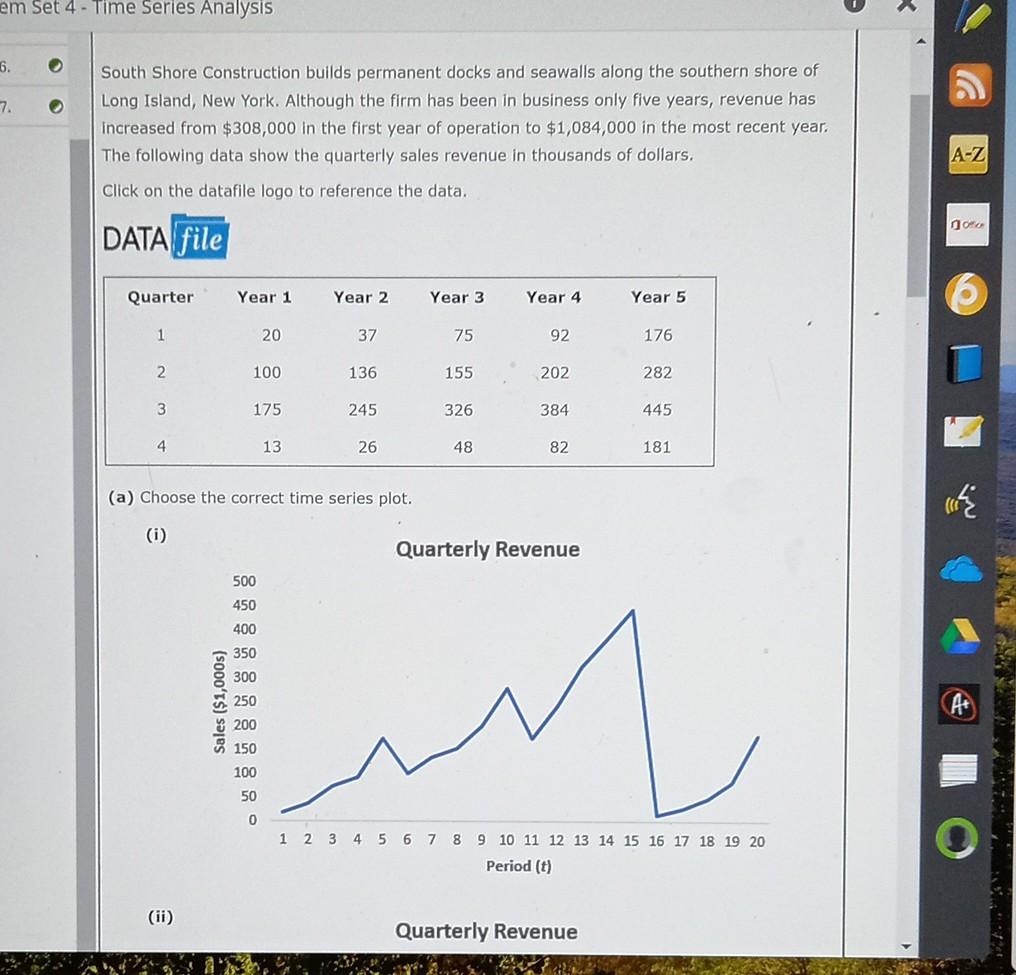
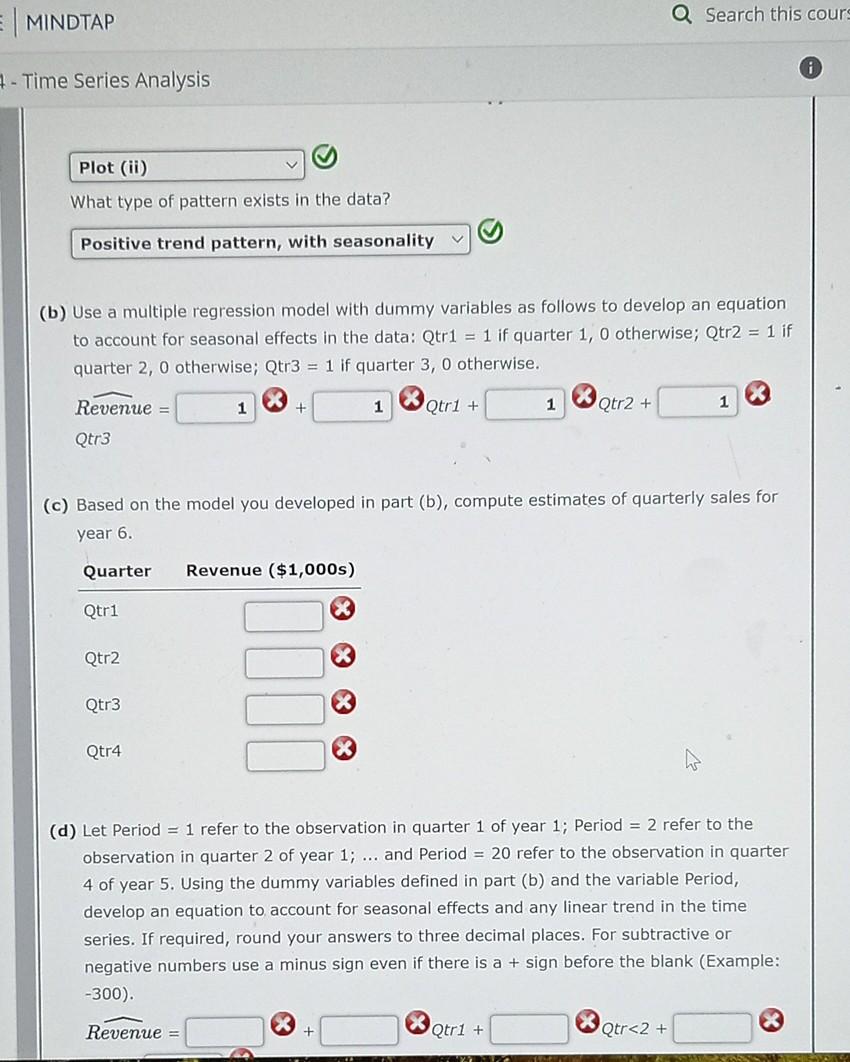
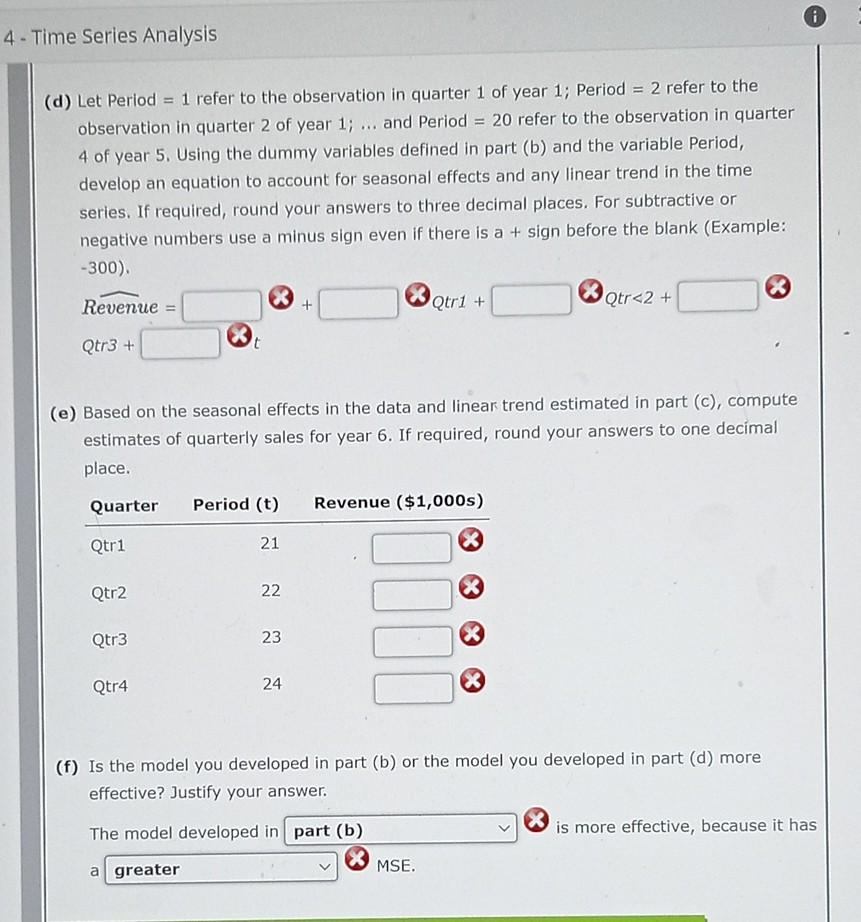
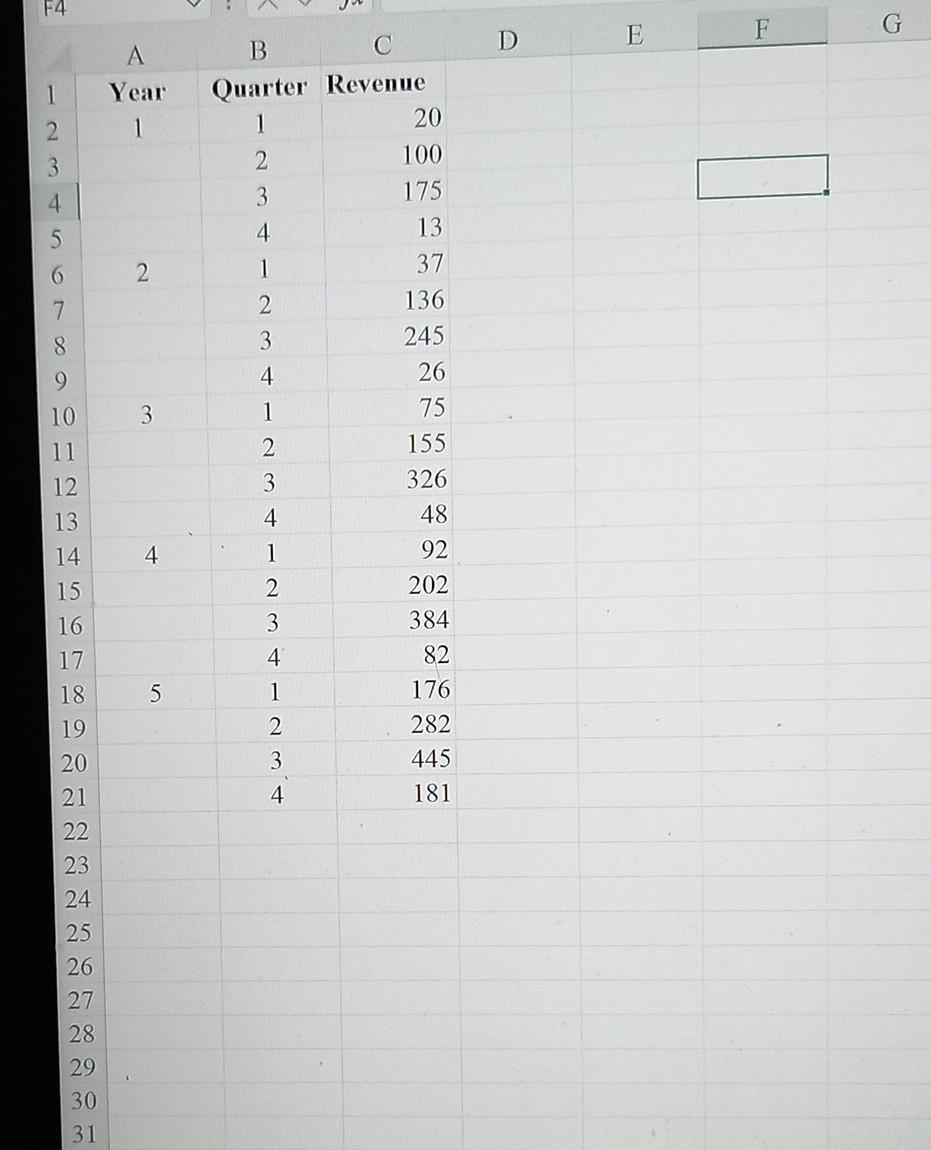
em Set 4 - Time Series Analysis 6. 7. South Shore Construction builds permanent docks and seawalls along the southern shore of Long Island, New York. Although the firm has been in business only five years, revenue has Increased from $308,000 in the first year of operation to $1,084,000 in the most recent year. The following data show the quarterly sales revenue in thousands of dollars. A-Z Click on the datafile logo to reference the data. 06 DATA file Quarter Year 1 Year 2 Year 3 Year 4 Year 5 1 20 37 75 92 176 2. 100 136 155 202 282 3 175 245 326 384 445 4 13 26 48 82 181 (a) Choose the correct time series plot. li (i) Quarterly Revenue 500 450 400 350 Sales ($1,000s) 300 250 200 150 n u 100 50 0 1 2 3 4 5 6 7 8 9 10 11 12 13 14 15 16 17 18 19 20 Period (t) (ii) Quarterly Revenue E MINDTAP Q Search this cours - Time Series Analysis Plot (ii) What type of pattern exists in the data? Positive trend pattern, with seasonality (b) Use a multiple regression model with dummy variables as follows to develop an equation to account for seasonal effects in the data: Qtr 1 = 1 if quarter 1, 0 otherwise; Qtr2 = 1 if quarter 2,0 otherwise; Qtr3 = 1 if quarter 3, 0 otherwise. 1 1 + Qtrl + 1 1 Qtr2 + Revenue Qtr3 (c) Based on the model you developed in part (b), compute estimates of quarterly sales for year 6. Quarter Revenue ($1,000s) Qtri Qtr2 Qtr3 Qtr4 (d) Let Period = 1 refer to the observation in quarter 1 of year 1; Period = 2 refer to the observation in quarter 2 of year 1; ... and Period = 20 refer to the observation in quarter 4 of year 5. Using the dummy variables defined in part (b) and the variable Period, develop an equation to account for seasonal effects and any linear trend in the time series. If required, round your answers to three decimal places. For subtractive or negative numbers use a minus sign even if there is a + sign before the blank (Example: -300). Revenue = X X Qtr1 + Qtr
Step by Step Solution
There are 3 Steps involved in it

Get step-by-step solutions from verified subject matter experts