

Question: time series analysis business forecasting use python!! 3. The electricity consumption of a certain city (in coded units) from 1991 to 1997 is given in
time series analysis business forecasting
use python!!
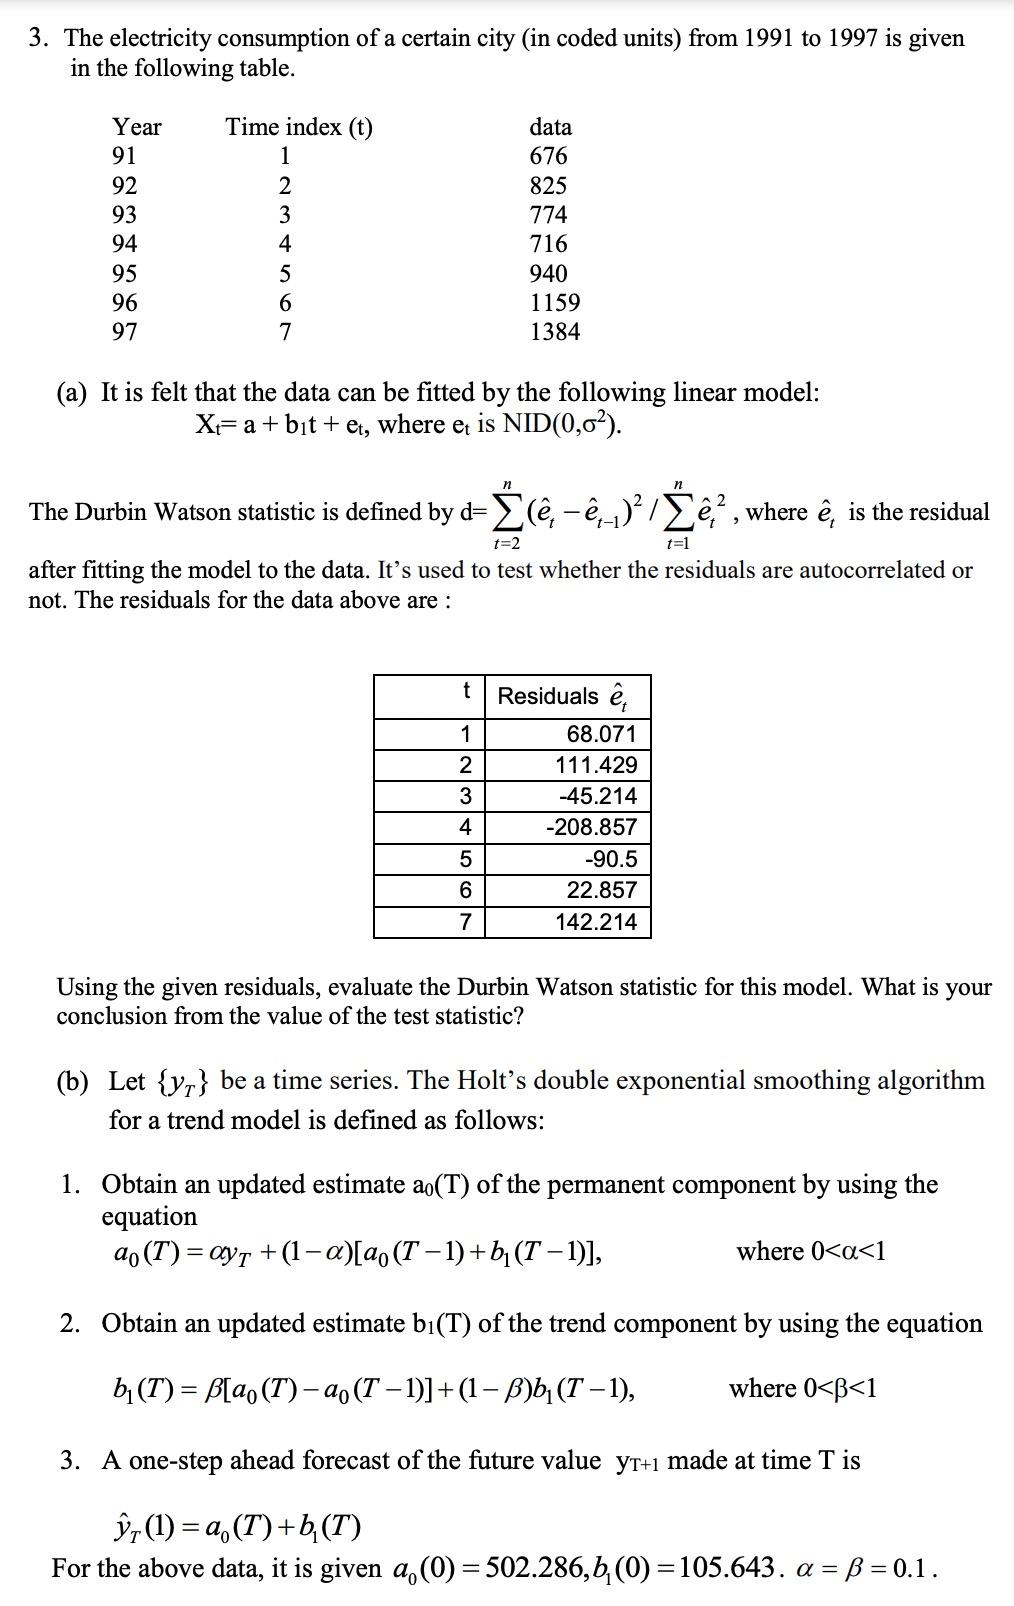
3. The electricity consumption of a certain city (in coded units) from 1991 to 1997 is given in the following table. (a) It is felt that the data can be fitted by the following linear model: Xt=a+b1t+et,whereetisNID(0,2). The Durbin Watson statistic is defined by d=t=2n(e^te^t1)2/t=1ne^t2, where e^t is the residual after fitting the model to the data. It's used to test whether the residuals are autocorrelated or not. The residuals for the data above are : Using the given residuals, evaluate the Durbin Watson statistic for this model. What is your conclusion from the value of the test statistic? (b) Let {yT} be a time series. The Holt's double exponential smoothing algorithm for a trend model is defined as follows: 1. Obtain an updated estimate a0(T) of the permanent component by using the equation a0(T)=yT+(1)[a0(T1)+b1(T1)],where0
Step by Step Solution
There are 3 Steps involved in it

Get step-by-step solutions from verified subject matter experts