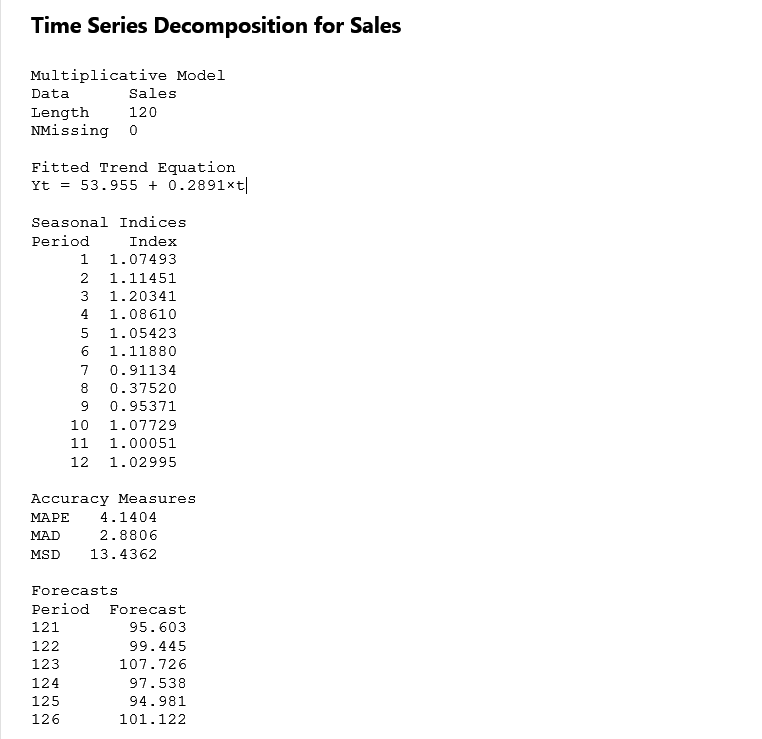
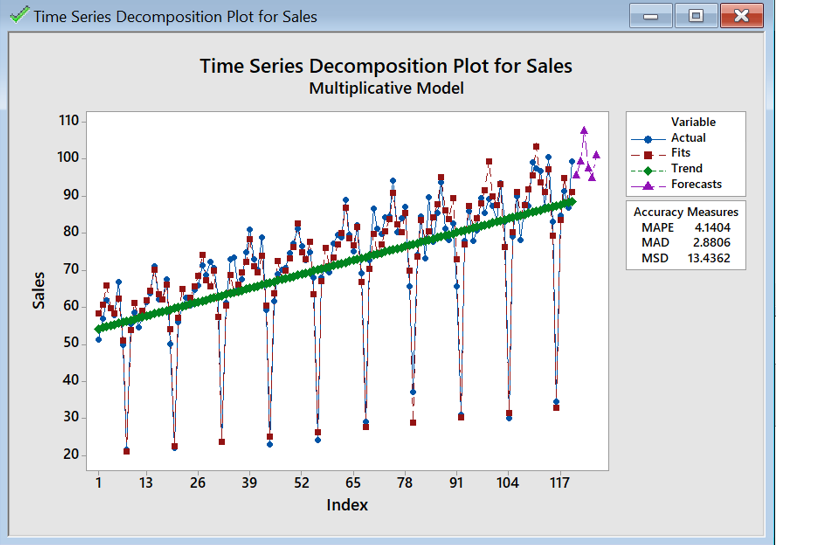
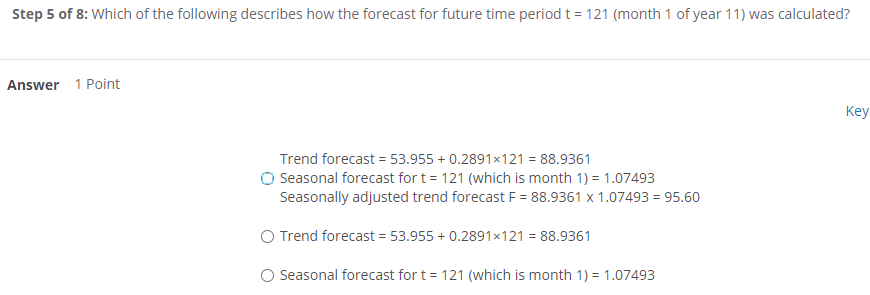
Question: Time Series Decomposition for Sales Multiplicative Model Data Sales Length 120 NMissing 0 Fitted Trend Equation Yt = 53.955 + 0.2891xt|| Seasonal Indices Period Index

Time Series Decomposition for SalesTime Series Decomposition for Sales

Time Series Decomposition for SalesTime Series Decomposition for SalesTime Series Decomposition for SalesTime Series Decomposition for SalesTime Series Decomposition for SalesTime Series Decomposition for SalesTime Series Decomposition for SalesTime Series Decomposition for Sales

Time Series Decomposition for Sales Multiplicative Model Data Sales Length 120 NMissing 0 Fitted Trend Equation Yt = 53.955 + 0.2891xt|| Seasonal Indices Period Index 1 1.07493 2 1.11451 3 1.20341 4 1.08610 5 1.05423 6 1.11880 7 0.91134 8 0.37520 9 0.95371 10 1.07729 11 1.00051 12 1.02995 Accuracy Measures MAPE 4.1404 MAD 2.8806 MSD 13.4362 Forecasts Period Forecast 121 95.603 122 99.445 123 107.726 124 97.538 125 94.981 126 101.122 Time Series Decomposition Plot for Sales Time Series Decomposition Plot for Sales Multiplicative Model 110 100 90 Variable Actual Fits Trend Forecasts Accuracy Measures MAPE 4.1404 MAD 2.8806 MSD 13.4362 80 70 Sales 60 50 40 30 20 1 13 26 39 52 78 91 104 117 65 Index Step 1 of 8: Interpret the seasonal index for month 3. Answer Point Values in month 3 average about 120% below the trend line. O Values in month 3 average about 20% above the trend line. Values in month 3 average about 120% above the trend line. Values in month 3 average about 20% below the trend line. Step 3 of 8: Interpret the slope of the trend line. Answer Point O Sales tend to decrease about 53.955 units per month Sales tend to increase about 53.955 units per month Sales tend to decrease about 0.2891 units per month Sales tend to increase about 0.2891 units per month Step 6 of 8: Forecast the trend component for time period t = 127, which is month 7 of year 11). Round to 3 decimal places. Answer Point Step 8 of 8: Calculate the seasonally adjusted trend forecast for time period t= 127, which is month 7 of year 11. Round to two decimal places. Answer Point Step 7 of 8: What is the seasonal component forecast for time period 127, which is month 7 of year 11? Round to 5 decimal places. Answer Point Step 2 of 8: Interpret the seasonal index for month 7. Answer Point O Values in month 7 average about 9% below the trend line O Values in month 7 average about 9% above the trend line O Values in month 7 average about 91% below the trend line O Values in month 7 average about 91% above the trend line Step 5 of 8: Which of the following describes how the forecast for future time period t = 121 (month 1 of year 11) was calculated? Answer Point Key Trend forecast = 53.955 +0.2891x121 = 88.9361 O Seasonal forecast for t = 121 (which is month 1) = 1.07493 Seasonally adjusted trend forecast F = 88.9361 x 1.07493 = 95.60 O Trend forecast = 53.955 +0.2891x121 = 88.9361 O Seasonal forecast for t = 121 (which is month 1) = 1.07493 Step 4 of 8: Interpret the accuracy Measures, in particular MAPE, to determine how accurate the forecasts are likely to be. Answer 1 Point Keyb O The MAPE is 4.14%, which is a very high percentage error; therefore, we do NOT expect forecasts to be very accurate. The MAPE is only 4.14%, which is a very low percentage error; therefore, we expect forecasts to be very accurate

Step by Step Solution

There are 3 Steps involved in it

1 Expert Approved Answer
Step: 1 Unlock blur-text-image
Question Has Been Solved by an Expert!

Get step-by-step solutions from verified subject matter experts

Step: 2 Unlock
Step: 3 Unlock

Students Have Also Explored These Related General Management Questions!