

Question: Time - Temperature Transformation Diagrams ( > ) The percentage of austenite transformed is a function of temperature and time. Q 1 :
TimeTemperature Transformation Diagrams
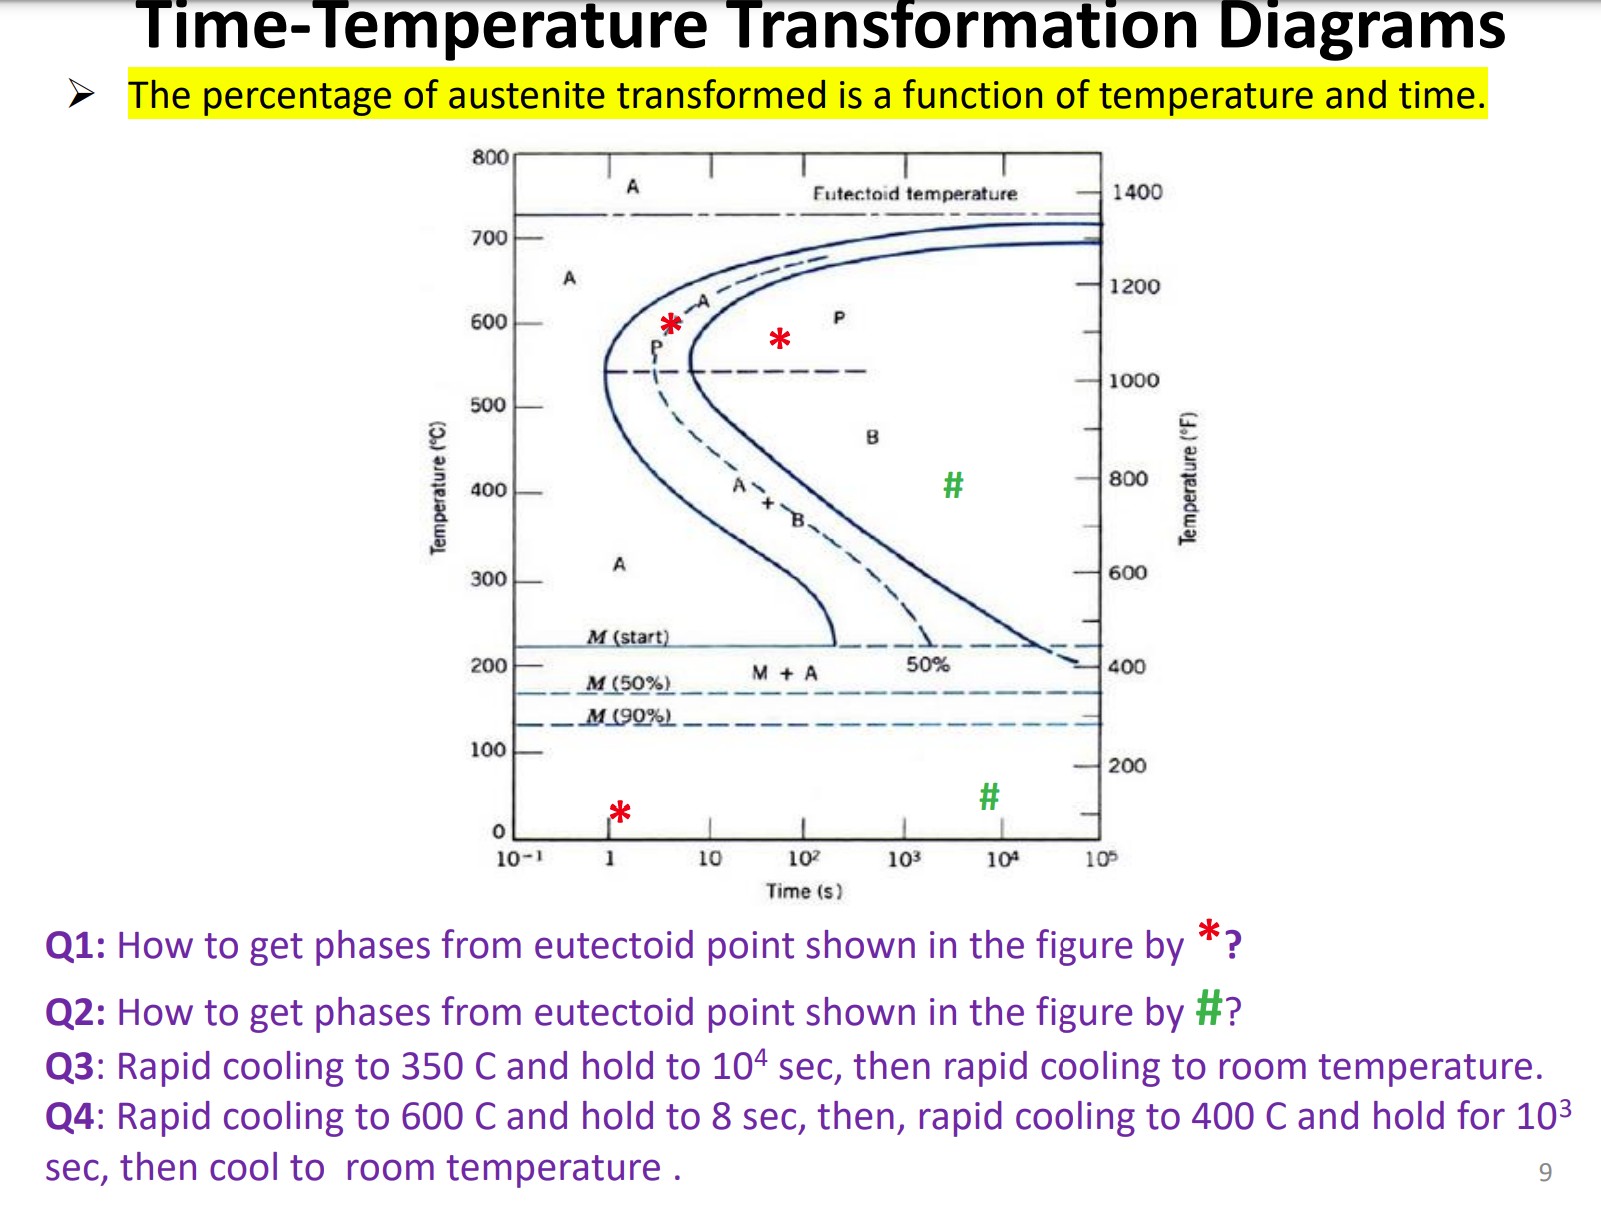
The percentage of austenite transformed is a function of temperature and time.
Q: How to get phases from eutectoid point shown in the figure by
Q: How to get phases from eutectoid point shown in the figure by #
Q: Rapid cooling to C and hold to mathrmsec then rapid cooling to room temperature. Q: Rapid cooling to C and hold to sec then, rapid cooling to C and hold for sec then cool to room temperature.
Step by Step Solution
There are 3 Steps involved in it
1 Expert Approved Answer
Step: 1 Unlock

Question Has Been Solved by an Expert!
Get step-by-step solutions from verified subject matter experts
Step: 2 Unlock
Step: 3 Unlock