

Question: tion 2 of 13 > Classify each histogram using the appropriate descriptions. Identify all Frequency Macmillan Learning 6 4 IQ distribution of high school
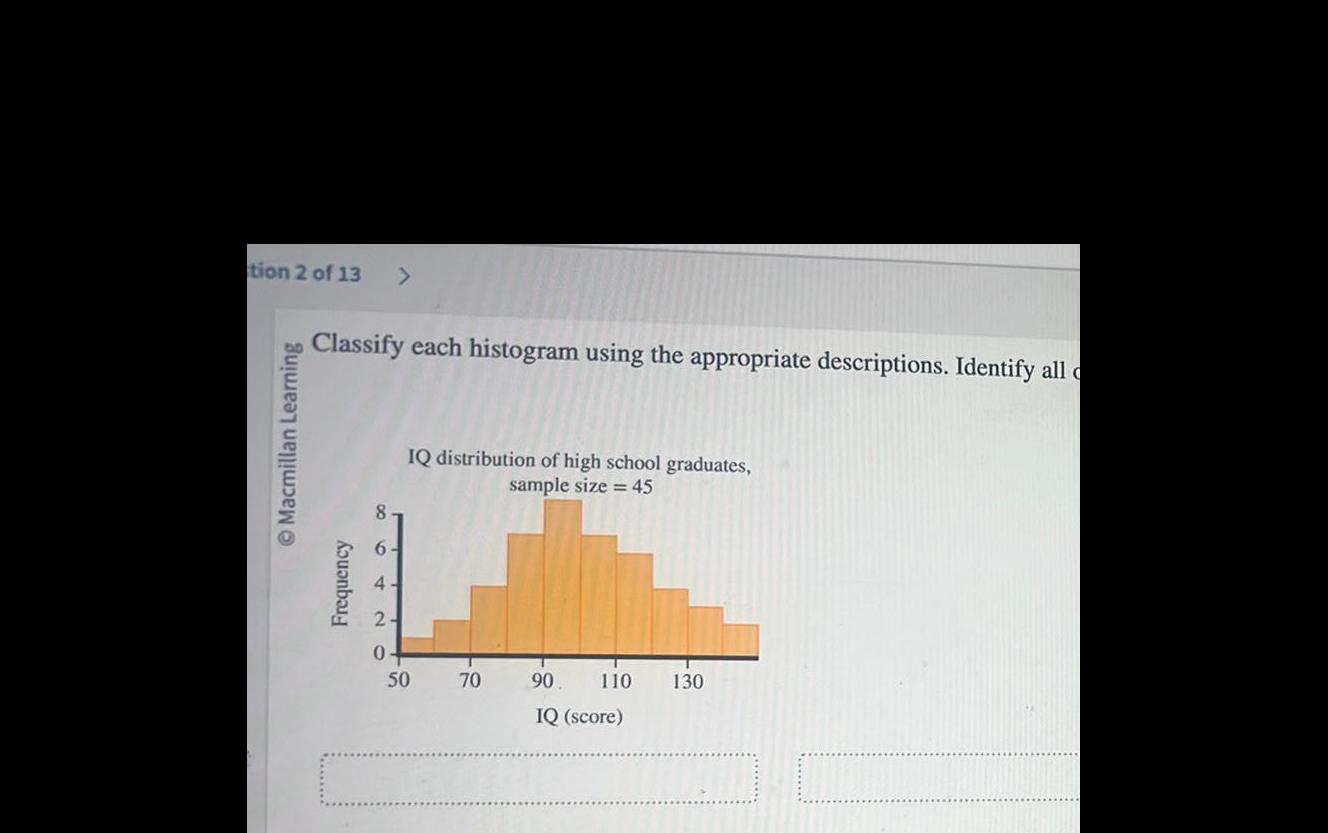
tion 2 of 13 > Classify each histogram using the appropriate descriptions. Identify all Frequency Macmillan Learning 6 4 IQ distribution of high school graduates, sample size = 45 2 0 50 70 90 110 130 IQ (score)
Step by Step Solution
There are 3 Steps involved in it
1 Expert Approved Answer
Step: 1 Unlock

Question Has Been Solved by an Expert!
Get step-by-step solutions from verified subject matter experts
Step: 2 Unlock
Step: 3 Unlock