

Question: TIPS ( for both Problems 2 and 3 ) : Assume all sample data is normal ( i . e . , no need to
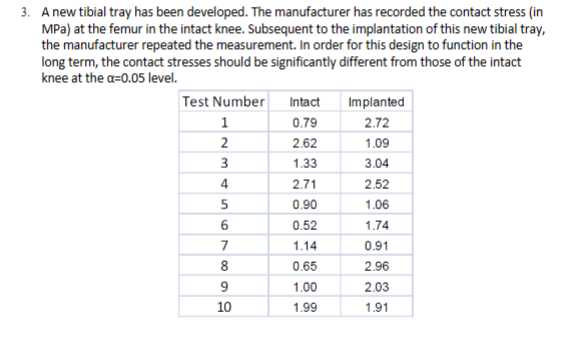
TIPS for both Problems and : Assume all sample data is normal ie no need to check for normality or perform Box Cox transformation Specify which statistical test to use and 'why' for this problem. Be as specific as you can, including whether a post hoc test is to be performed. Apply that statistical test to data in this problem report the associated p value, and perform post hoc test, if needed, to indicate which group pairs have a significant difference. You can use any statistical software you like.....I will only provide technical guidance for Matlab. Note: post hoc test done in Matlab using 'multcompare'. Report the mean and standard deviation for each group and include a plot with correctly labeled axes that displays these mean and standard deviations values for each group against one another. You can hand draw the plot and manually compute meanstandard deviation values, or you can use software package eg Excel, 'errorbar' function in Matlab A new tibial tray has been developed. The manufacturer has recorded the contact stress in MPa at the femur in the intact knee. Subsequent to the implantation of this new tibial tray, the manufacturer repeated the measurement. In order for this design to function in the long term, the contact stresses should be significantly different from those of the intact knee at the alpha level.
Step by Step Solution
There are 3 Steps involved in it
1 Expert Approved Answer
Step: 1 Unlock

Question Has Been Solved by an Expert!
Get step-by-step solutions from verified subject matter experts
Step: 2 Unlock
Step: 3 Unlock