

Question: Titanic Data Story assignment: Go to haggle .com > Titanic: Machine Learning from Disaster and download (train. csv) Generate Descriptive Statistics and describe the situation
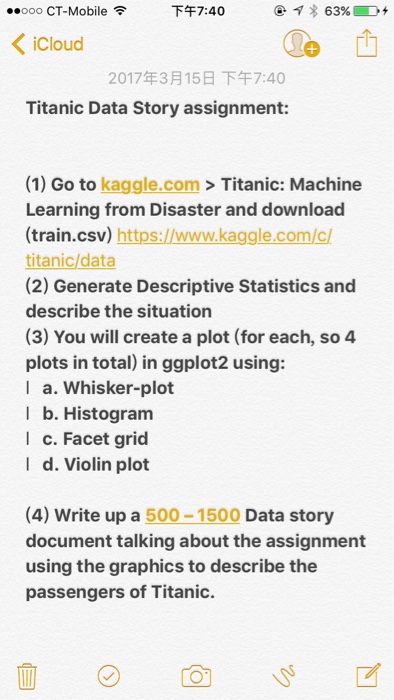
Titanic Data Story assignment: Go to haggle .com > Titanic: Machine Learning from Disaster and download (train. csv) Generate Descriptive Statistics and describe the situation You will create a plot (for each, so 4 plots in total) in ggplot2 using: Whisker - plot Histogram Facet Grid Violin plot Write up a 500 - 1500 Data story document talking about the assignment using the graphics to describe the passengers of Titanic
Step by Step Solution
There are 3 Steps involved in it
1 Expert Approved Answer
Step: 1 Unlock

Question Has Been Solved by an Expert!
Get step-by-step solutions from verified subject matter experts
Step: 2 Unlock
Step: 3 Unlock