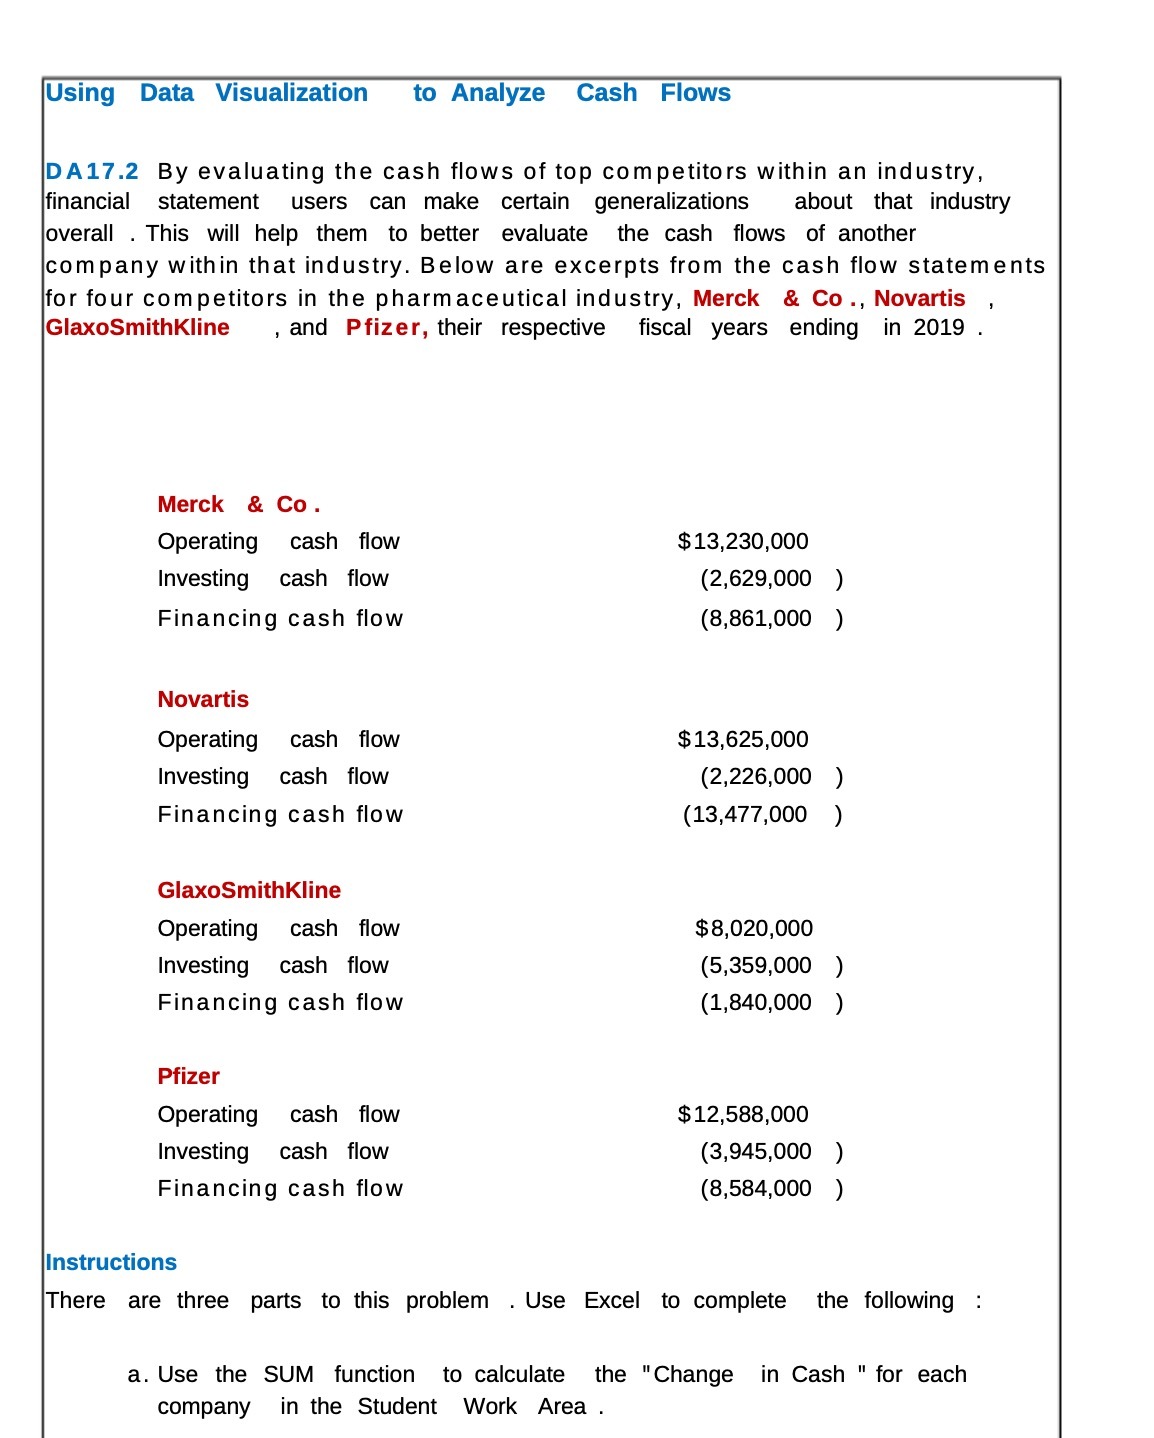
Question: to Analyze Cash Flows Using Data Visualization DA17.2 By evaluating the cash flows of top competitors within an industry, financial statement users can make certain

to Analyze Cash Flows Using Data Visualization
to Analyze Cash Flows Using Data Visualization DA17.2 By evaluating the cash flows of top competitors within an industry, financial statement users can make certain generalizations about that industry overall .This will help them to better evaluate the cash flows of another company within that industry. Below are excerpts from the cash flow statements GlaxoSmithKline Merck & Co . Operating Investing cash ow cash flow Financing cash flow Novartis Operating cash flow Investing cash flow Financing cash flow GlaxoSmithKline Operating Investing Financing cash flow cash flow cash flow Pfizer Operating cash flow Investing Financing cash flow cash flow fiscal years ending $13,230,000 (2,329,000 (3,331,000 $13,625,000 (2,226,000 (13,477,000 $3,020,000 (5,359,000 (1,340,000 $12,533,000 (3,945,000 (3,534,000 for four competitors in the pharmaceutical industry, Merck & Co ., Novartis ,and Pfizer, their respective in 2019 . Instructions There are three parts to this problem .Use Excel to complete the following a. Use the SUM function in Cash " for each company in the Student to calculate the "Change Work Area

Step by Step Solution

There are 3 Steps involved in it

1 Expert Approved Answer
Step: 1 Unlock blur-text-image
Question Has Been Solved by an Expert!

Get step-by-step solutions from verified subject matter experts

Step: 2 Unlock
Step: 3 Unlock

Students Have Also Explored These Related Accounting Questions!