

Question: To answer this question, use the relevant information based on the selected financial and economic indicators of Country G and Country H provided in the
To answer this question, use the relevant information based on the selected financial and economic indicators of Country G and Country H provided in the Appendix (Figures 6 and 7) and make the necessary assumptions to solve it. Be sure to answer all sub-questions. Support your answer with any necessary calculation, explain your calculations, support your answers, and state any relevant assumptions required in detail. Company XYZ is contemplating building a production unit in either Country G or Country H (see Figures 6 and 7 in the Appendix). Evaluate and provide a comparative assessment of the sovereign credit risk in Year 5 in Country G and Country H, documented in Figure 6 and Figure 7, using each of the six criteria (below). For each of the six criteria, rank the countries according to risk level where "1" is "the riskiest" and "2" is the "least risky country", and explain why. Explain in detail which countries (if any) have an overall low sovereign credit risk in year 5. What Sovereign Credit Rating would you attribute to Country G and H in Year 5 (above or below Investment Grade). Use a maximum of 250 words. Criteria presented: - Government Finances - National Accounts - Balance of Payments - Interest and Inflation Rates - Exchange Rate and money supply - Global credit risk assessment
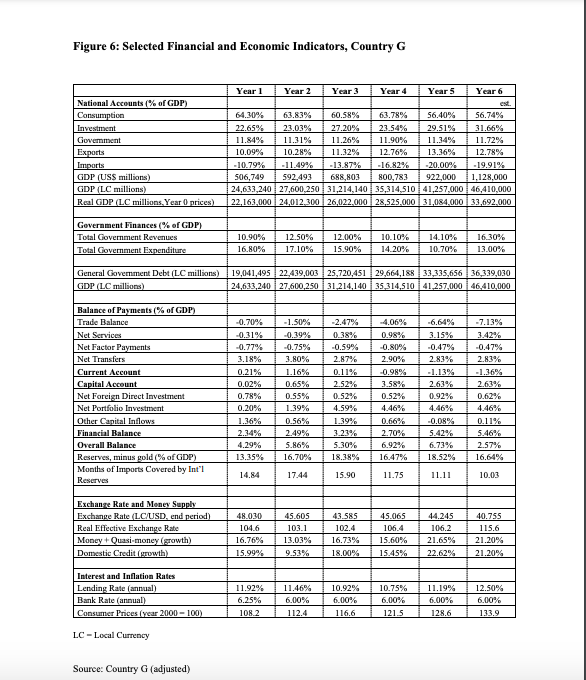
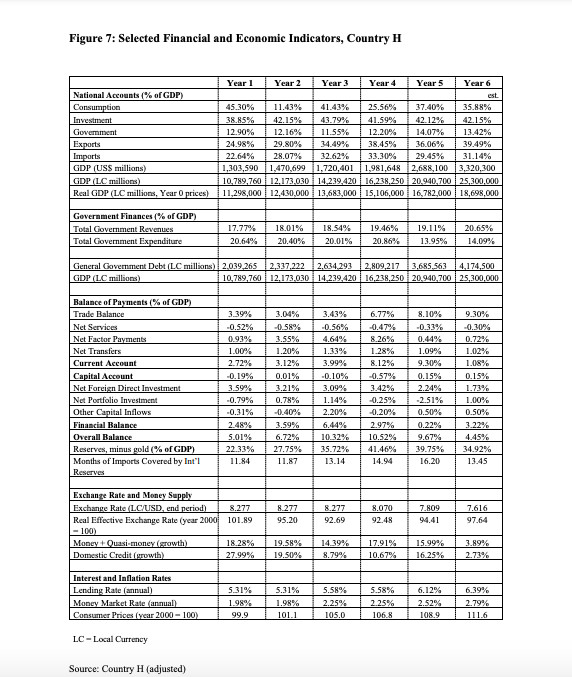
Figure 6: Selected Financial and Economic Indicators, Country G National Accounts (% of GDP) Consumption Investment Government Exports Imports GDP (USS millions) GDP (LC millions) Real GDP (LC millions. Year Oprices) Year 1 Year 2 Year 3 Year 4 Years Year 6 est 64.30% 63.83% 60.58% 63.78% 56.40% 56.74% 22.65% 23.03% 27.20% 23.54% 29.51% 31.66% 11.84% 11.31% 11.26% 11.90% 11.34% 11.72% 10.09% 10.28% 11.32% 12.76% 13.36% 12.78% -10.79% - 11.49% -13.87% -16.82% -20.00% -19.91% 506,749 592,493 688,803 800,783 922,000 1.128.000 24,633,240 27,600,250 31,214,140 35,314,510 41,257,000 46,410,000 22,163,000 24.012.300 26,022.000 28.525.000 i 31,084.000 i 33,692.000 Government Finances (% of GDP) Total Government Revenues Total Government Expenditure 10.90% 16.80% 12.50% 17.10% 12.00% 15.90% 10.10% 14.20% 14.10% 10.70% 16.30% 13.00% General Government Debt (LC millions) GDP (LC millions) 19,041,495 22,439,003 25,720,451 29,664,188 33,335,656 36,339,030 24,633,240 27,600,250 31,214,140 35,314,510 | 41 257,000 46,410,000 -7.13% -0.47% 2.83% Balance of Payments (% of GDP) Trade Balance Net Services Net Factor Payments Net Transfers Current Account Capital Account Net Foreign Direct Investment Net Portfolio Investment Other Capital Inflows Financial Balance Overall Balance Reserves, minus gold (% of GDP) Months of Imports Covered by Int'l Reserves -0.70% -0.31% -0.77% 3.18% 0.21% 0.02% 0.78% 0.20% 1.36% 2.34% 4.29% 13.35% -1.50% -0.39% -0.75% 3.80% 1.16% 0.65% 0.55% 1.39% 0.56% 2.49% 5.86% 16.70% -2.47% 0.38% -0.59% 2.87% 0.11% 2.52% 0.52% 4.59% 1.39% -4.06% 0.98% -0.80% 2.90% -0.98% 3.58% 0.52% 4.46% 0.66% 2.70% 6.92% 16.47% -6.64% 3.15% -0.47% 2.83% -1.13% 2.63% 0.92% 4.46% -0.08% 5.42% 6.73% 18.52% 2.63% 0.62% 4.46% 0.11% 5.46% 2.57% 16.64% 5.30% 18.38% 14.84 17.44 15.90 11.75 11.11 10.03 Exchange Rate and Money Supply Exchange Rate (LC/USD, end period) Real Effective Exchange Rate Money + Quasi-money (growth) Domestic Credit (growth) 48.000 104.6 16.76% 15.99% 45.605 103.1 13.03% 9.53% 43.585 102.4 16.73% 18.00% 45.065 106.4 15.60% 15.45% 44.245 106.2 21.65% 22.62% 40.755 115.6 21.20% 21.20% Interest and Inflation Rates Lending Rate (annual) Bank Rate (annual) Consumer Prices (year 2000 - 100) 11.92% 6.25% 108.2 11.46% 6.00% 112.4 10.92% 6.00% 116.6 10.75% 6.00% 121.5 11.19% 6.00% 128.6 12.50% 6.00% 133.9 LC - Local Currency Source: Country G (adjusted) Figure 7: Selected Financial and Economic Indicators, Country H National Accounts (% of GDP) Consumption Investment Government Exports Imports GDP (USS millions) GDP (LC millions) Real GDP (LC millions, Year Oprices) Year 1 Year 2 Year 3 Year 4 Year 5 Year 6 est. 45.30% 11.43% 41.43% 25.56% 37.40% 35.88% 38.85% 42.15% 43.79% 41.59% 42.12% 42.15% 12.90% 12.16% 11.55% 12.20% 14.07% 13.42% 24.98% 29.80% 34.49% 38.45% 36.06% 39.49% 22.64% 28.07% 32.62% 33.30% 29.45% 31.14% 1,303,590 1,470,699 1,720,401 1,981,648 2,688,100 3,320,300 10,789,760 12.173.030 14.239.420 16,238,250 20.940,700 25.300.000 11,298,000 12.430,000 13,683,000 15,106,000 16,782,000 18,698,000 Government Finances (% of GDP) Total Government Revenues Total Government Expenditure 17.77% 20.64% 18.01% 20.40% 18.54% 20.01% 19.46% 20.86% 19.11% 13.95% 20.65% 14.09% General Government Debt (LC millions) 2.039.265 2,337,222 2,634.293 2,809,217 3,685,563 4,174,500 GDP (LC millions) 10,789,760 12,173,030 14,239,420 16,238,250 20.940,700 25,300,000 Balance of Payments (% of GDP) Trade Balance Net Services Net Factor Payments Net Transfers Current Account Capital Account Net Foreign Direct Investment Net Portfolio Investment Other Capital Inflows Financial Balance Overall Balance Reserves, minus gold (% of GDP) Months of Imports Covered by Int'l Reserves 3.39% -0.52% 0.93% 1.00% 2.72% -0.19% 3.59% -0.79% -0.31% 2.48% 5.01% 22.33% 11.84 3.04% -0.58% 3.55% 1.20% 3.12% 0.01% 3.21% 0.78% -0.40% 3.59% 6.72% 27.75% 11.87 3.43% -0.56% 4.64% 1.33% 3.99% -0.10% 3.09% 1.14% 2.20% 6.44% 10.32% 35.72% 13.14 6.77% -0.47% 8.26% 1.28% 8.12% -0.57% 3.42% -0.25% -0.20% 2.97% 10.52% 41.46% 14.94 8.10% -0.33% 0.44% 1.09% 9.30% 0.15% 2.24% -2.51% 0.50% 0.22% 9.67% 39.75% 16.20 9.30% -0.30% 0.72% 1.02% 1.08% 0.15% 1.73% 1.00% 0.50% 3.22% 4.45% 34.92% 13.45 8.277 95.20 8.277 92.69 8.070 92.48 7.809 94.41 7.616 97.64 Exchange Rate and Money Supply Exchange Rate (LC/USD, end period) 8.277 Real Effective Exchange Rate (year 2000 101.89 -100) Money + Quasi-money (growth) 18.28% Domestic Credit (growth) 27.99% 19.58% 19.50% 14.39% 8.79% 17.91% 10.67% 15.99% 16.25% 3.89% 2.73% Interest and Inflation Rates Lending Rate (annual) Money Market Rate (annual) Consumer Prices (year 2000-100) 5.31% 1.98% 99.9 5.31% 1.98% 101.1 5.58% 2.25% 105.0 5.58% 2.25% 106.8 6.12% 2.52% 108.9 6.39% 2.79% 111.6 LC - Local Currency Source: Country H (adjusted) Figure 6: Selected Financial and Economic Indicators, Country G National Accounts (% of GDP) Consumption Investment Government Exports Imports GDP (USS millions) GDP (LC millions) Real GDP (LC millions. Year Oprices) Year 1 Year 2 Year 3 Year 4 Years Year 6 est 64.30% 63.83% 60.58% 63.78% 56.40% 56.74% 22.65% 23.03% 27.20% 23.54% 29.51% 31.66% 11.84% 11.31% 11.26% 11.90% 11.34% 11.72% 10.09% 10.28% 11.32% 12.76% 13.36% 12.78% -10.79% - 11.49% -13.87% -16.82% -20.00% -19.91% 506,749 592,493 688,803 800,783 922,000 1.128.000 24,633,240 27,600,250 31,214,140 35,314,510 41,257,000 46,410,000 22,163,000 24.012.300 26,022.000 28.525.000 i 31,084.000 i 33,692.000 Government Finances (% of GDP) Total Government Revenues Total Government Expenditure 10.90% 16.80% 12.50% 17.10% 12.00% 15.90% 10.10% 14.20% 14.10% 10.70% 16.30% 13.00% General Government Debt (LC millions) GDP (LC millions) 19,041,495 22,439,003 25,720,451 29,664,188 33,335,656 36,339,030 24,633,240 27,600,250 31,214,140 35,314,510 | 41 257,000 46,410,000 -7.13% -0.47% 2.83% Balance of Payments (% of GDP) Trade Balance Net Services Net Factor Payments Net Transfers Current Account Capital Account Net Foreign Direct Investment Net Portfolio Investment Other Capital Inflows Financial Balance Overall Balance Reserves, minus gold (% of GDP) Months of Imports Covered by Int'l Reserves -0.70% -0.31% -0.77% 3.18% 0.21% 0.02% 0.78% 0.20% 1.36% 2.34% 4.29% 13.35% -1.50% -0.39% -0.75% 3.80% 1.16% 0.65% 0.55% 1.39% 0.56% 2.49% 5.86% 16.70% -2.47% 0.38% -0.59% 2.87% 0.11% 2.52% 0.52% 4.59% 1.39% -4.06% 0.98% -0.80% 2.90% -0.98% 3.58% 0.52% 4.46% 0.66% 2.70% 6.92% 16.47% -6.64% 3.15% -0.47% 2.83% -1.13% 2.63% 0.92% 4.46% -0.08% 5.42% 6.73% 18.52% 2.63% 0.62% 4.46% 0.11% 5.46% 2.57% 16.64% 5.30% 18.38% 14.84 17.44 15.90 11.75 11.11 10.03 Exchange Rate and Money Supply Exchange Rate (LC/USD, end period) Real Effective Exchange Rate Money + Quasi-money (growth) Domestic Credit (growth) 48.000 104.6 16.76% 15.99% 45.605 103.1 13.03% 9.53% 43.585 102.4 16.73% 18.00% 45.065 106.4 15.60% 15.45% 44.245 106.2 21.65% 22.62% 40.755 115.6 21.20% 21.20% Interest and Inflation Rates Lending Rate (annual) Bank Rate (annual) Consumer Prices (year 2000 - 100) 11.92% 6.25% 108.2 11.46% 6.00% 112.4 10.92% 6.00% 116.6 10.75% 6.00% 121.5 11.19% 6.00% 128.6 12.50% 6.00% 133.9 LC - Local Currency Source: Country G (adjusted) Figure 7: Selected Financial and Economic Indicators, Country H National Accounts (% of GDP) Consumption Investment Government Exports Imports GDP (USS millions) GDP (LC millions) Real GDP (LC millions, Year Oprices) Year 1 Year 2 Year 3 Year 4 Year 5 Year 6 est. 45.30% 11.43% 41.43% 25.56% 37.40% 35.88% 38.85% 42.15% 43.79% 41.59% 42.12% 42.15% 12.90% 12.16% 11.55% 12.20% 14.07% 13.42% 24.98% 29.80% 34.49% 38.45% 36.06% 39.49% 22.64% 28.07% 32.62% 33.30% 29.45% 31.14% 1,303,590 1,470,699 1,720,401 1,981,648 2,688,100 3,320,300 10,789,760 12.173.030 14.239.420 16,238,250 20.940,700 25.300.000 11,298,000 12.430,000 13,683,000 15,106,000 16,782,000 18,698,000 Government Finances (% of GDP) Total Government Revenues Total Government Expenditure 17.77% 20.64% 18.01% 20.40% 18.54% 20.01% 19.46% 20.86% 19.11% 13.95% 20.65% 14.09% General Government Debt (LC millions) 2.039.265 2,337,222 2,634.293 2,809,217 3,685,563 4,174,500 GDP (LC millions) 10,789,760 12,173,030 14,239,420 16,238,250 20.940,700 25,300,000 Balance of Payments (% of GDP) Trade Balance Net Services Net Factor Payments Net Transfers Current Account Capital Account Net Foreign Direct Investment Net Portfolio Investment Other Capital Inflows Financial Balance Overall Balance Reserves, minus gold (% of GDP) Months of Imports Covered by Int'l Reserves 3.39% -0.52% 0.93% 1.00% 2.72% -0.19% 3.59% -0.79% -0.31% 2.48% 5.01% 22.33% 11.84 3.04% -0.58% 3.55% 1.20% 3.12% 0.01% 3.21% 0.78% -0.40% 3.59% 6.72% 27.75% 11.87 3.43% -0.56% 4.64% 1.33% 3.99% -0.10% 3.09% 1.14% 2.20% 6.44% 10.32% 35.72% 13.14 6.77% -0.47% 8.26% 1.28% 8.12% -0.57% 3.42% -0.25% -0.20% 2.97% 10.52% 41.46% 14.94 8.10% -0.33% 0.44% 1.09% 9.30% 0.15% 2.24% -2.51% 0.50% 0.22% 9.67% 39.75% 16.20 9.30% -0.30% 0.72% 1.02% 1.08% 0.15% 1.73% 1.00% 0.50% 3.22% 4.45% 34.92% 13.45 8.277 95.20 8.277 92.69 8.070 92.48 7.809 94.41 7.616 97.64 Exchange Rate and Money Supply Exchange Rate (LC/USD, end period) 8.277 Real Effective Exchange Rate (year 2000 101.89 -100) Money + Quasi-money (growth) 18.28% Domestic Credit (growth) 27.99% 19.58% 19.50% 14.39% 8.79% 17.91% 10.67% 15.99% 16.25% 3.89% 2.73% Interest and Inflation Rates Lending Rate (annual) Money Market Rate (annual) Consumer Prices (year 2000-100) 5.31% 1.98% 99.9 5.31% 1.98% 101.1 5.58% 2.25% 105.0 5.58% 2.25% 106.8 6.12% 2.52% 108.9 6.39% 2.79% 111.6 LC - Local Currency Source: Country H (adjusted)
Step by Step Solution
There are 3 Steps involved in it

Get step-by-step solutions from verified subject matter experts