

Question: To be specific, you are advised to analyze (compute and interpret) the following ratios and techniques: 1. Liquidity Ratios 2. Solvency Ratios 3. Profitability Ratios
To be specific, you are advised to analyze (compute and interpret) the following ratios and techniques:
1. Liquidity Ratios
2. Solvency Ratios
3. Profitability Ratios
4. Efficiency Ratios
5. Coverage Ratios
6. Market Perspect Ratios
7. Trend Analysis
8. Common Size Analysis
9. Du-Pont Analysis
10. Overall analysis of the company based on different ratios and techniques.
Overall points for this assignment are 25 marks (2.5 each part). Please make sure to interpret each and every ratio you have computed and every technique you have analyzed. The overall scores are sensitive to the interpretation of your results.
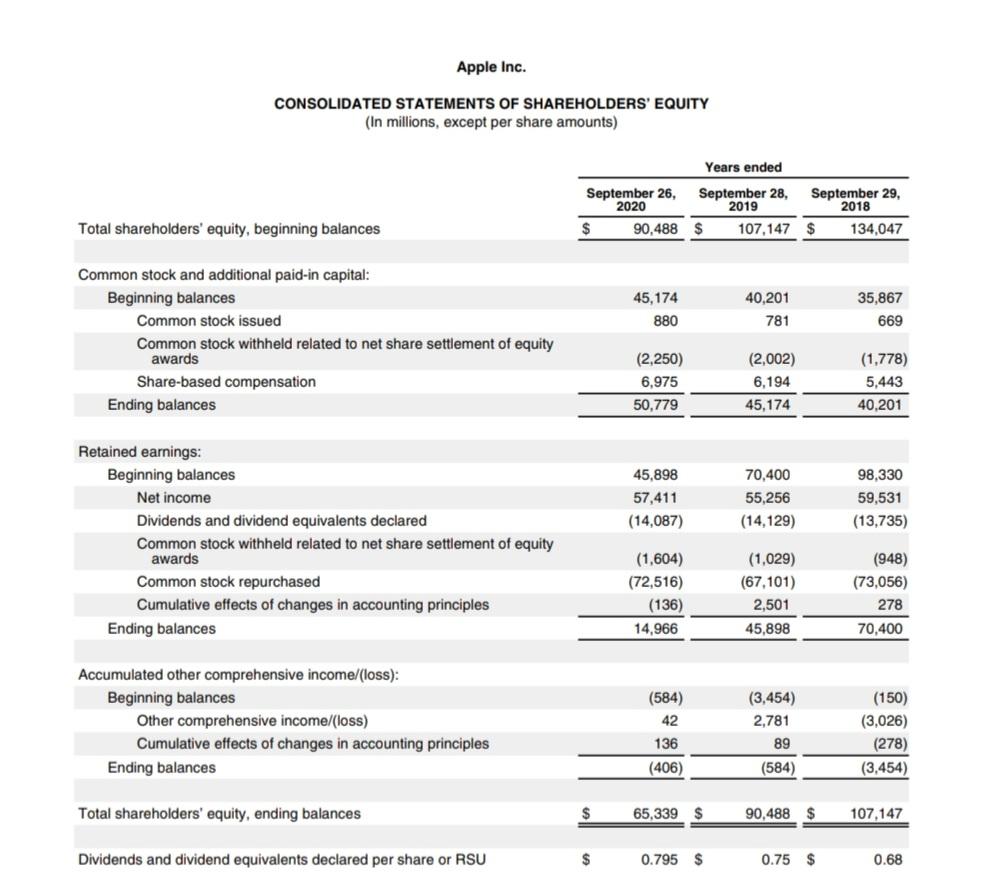
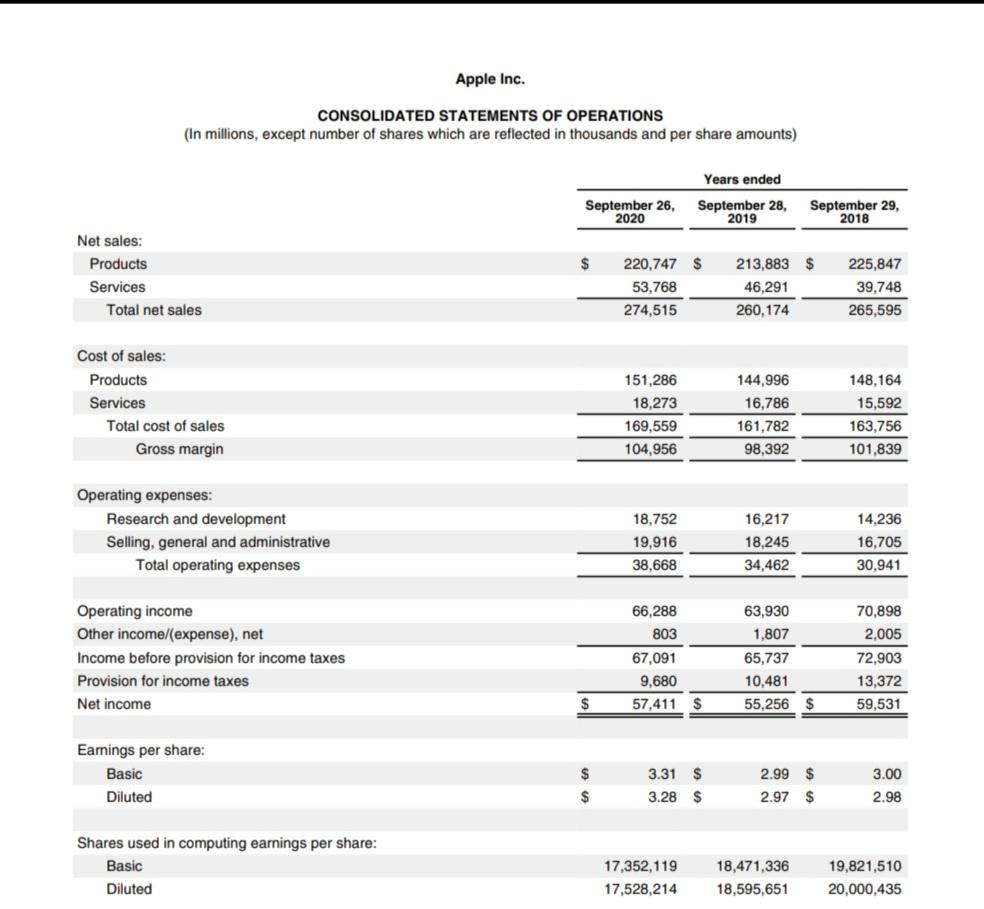
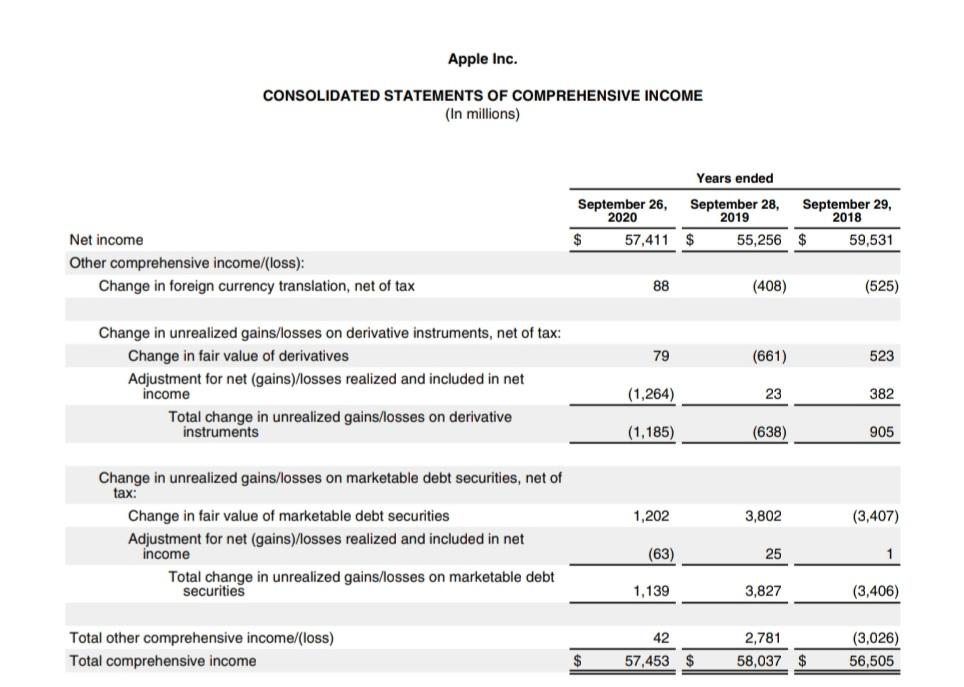
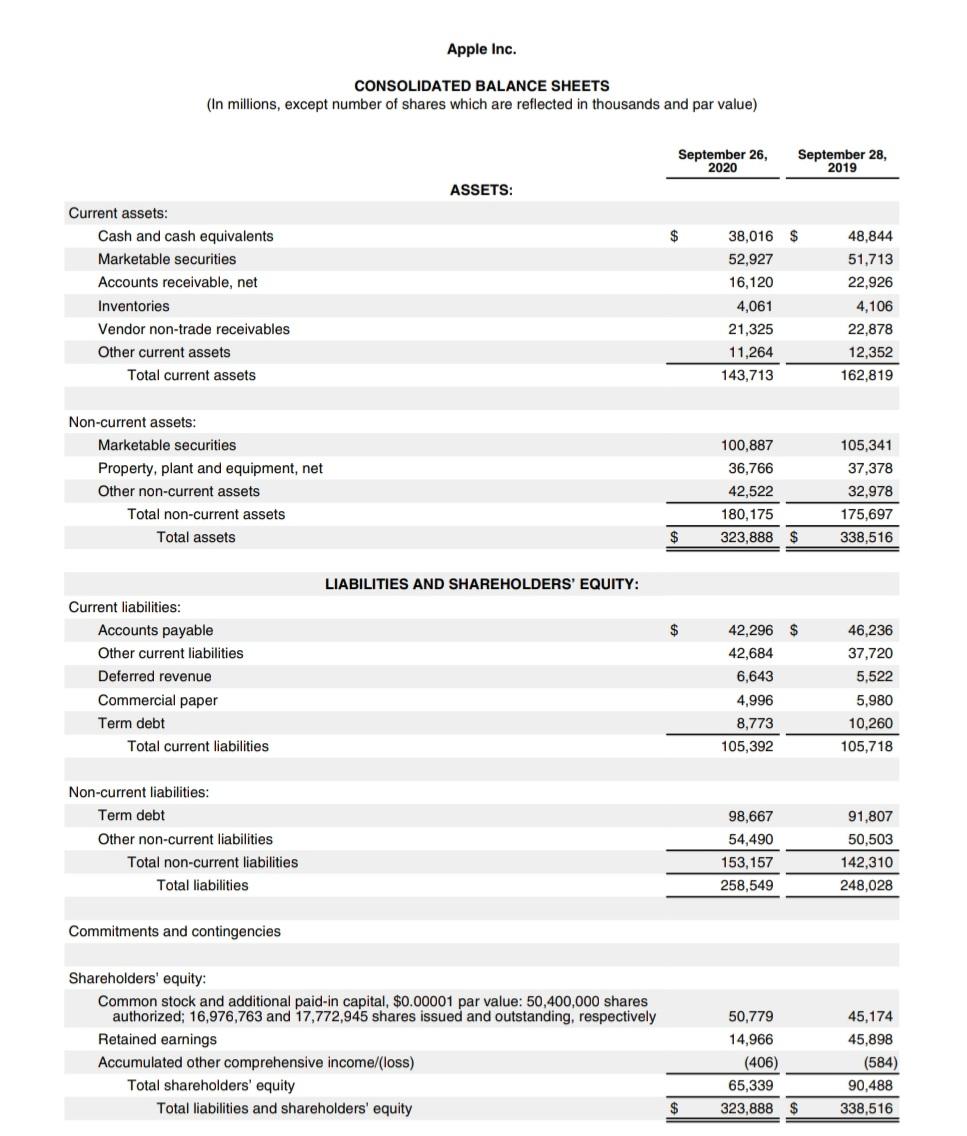
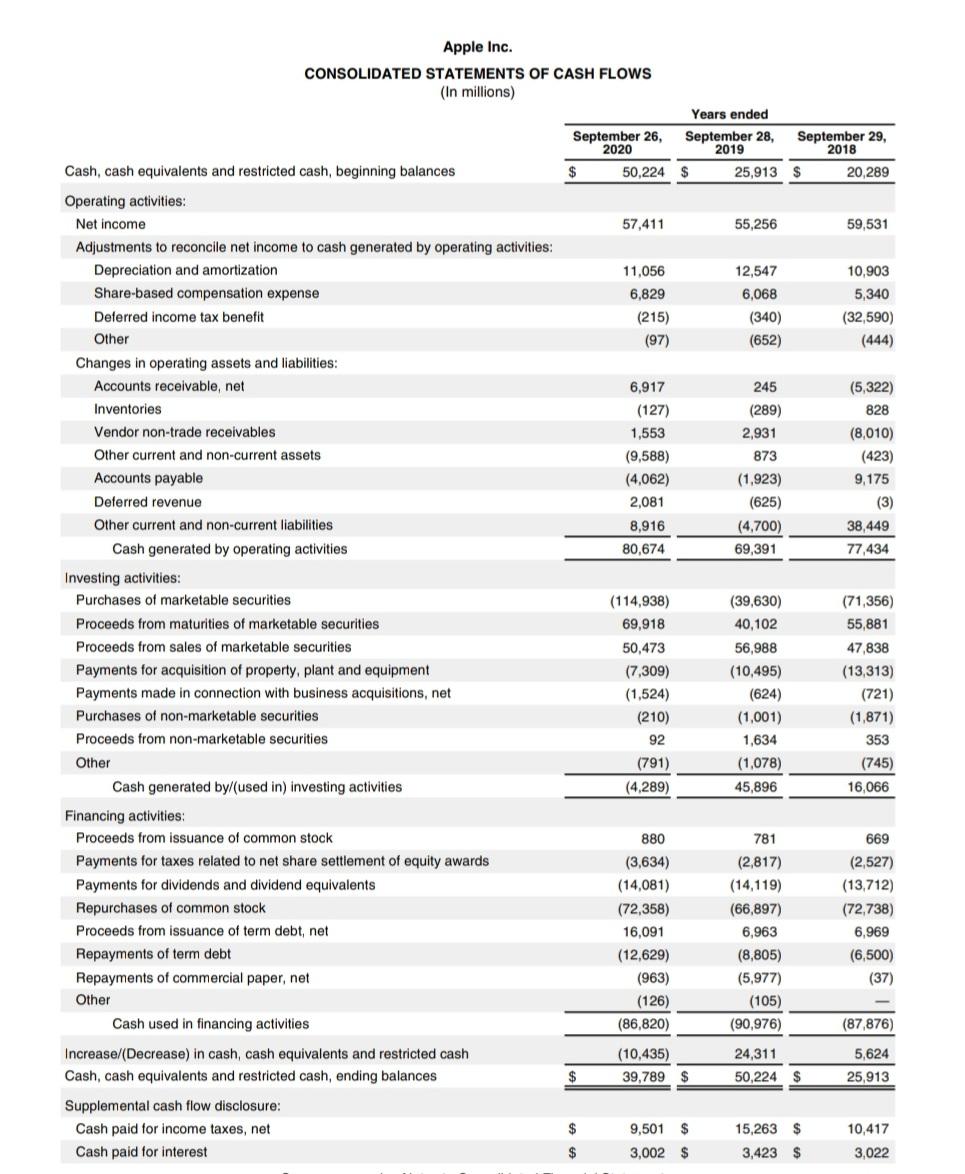
Apple Inc. CONSOLIDATED STATEMENTS OF SHAREHOLDERS' EQUITY (In millions, except per share amounts) Years ended September 26, September 28, September 29, 2020 2019 2018 $ 90,488 $ 107,147 $ 134,047 Total shareholders' equity, beginning balances 40,201 45,174 880 35,867 669 781 Common stock and additional paid-in capital: Beginning balances Common stock issued Common stock withheld related to net share settlement of equity awards Share-based compensation Ending balances (2,250) 6,975 (2,002) 6,194 45,174 (1.778) 5,443 50,779 40,201 45,898 57,411 (14,087) 70,400 55,256 (14,129) 98,330 59,531 (13,735) Retained earnings: Beginning balances Net income Dividends and dividend equivalents declared Common stock withheld related to net share settlement of equity awards Common stock repurchased Cumulative effects of changes in accounting principles Ending balances (1,604) (72,516) (136) 14,966 (1,029) (67,101) 2,501 45,898 (948) (73,056) 278 70,400 (584) Accumulated other comprehensive income/(loss): Beginning balances Other comprehensive income/loss) Cumulative effects of changes in accounting principles Ending balances 42 136 (3,454) 2,781 89 (584) (150) (3,026) (278) (3,454) (406) Total shareholders' equity, ending balances $ 65,339 $ 90,488 $ 107,147 Dividends and dividend equivalents declared per share or RSU $ 0.795 $ 0.75 $ 0.68 Apple Inc. CONSOLIDATED STATEMENTS OF OPERATIONS (In millions, except number of shares which are reflected in thousands and per share amounts) Years ended September 26, 2020 September 28, 2019 September 29, 2018 $ Net sales: Products Services Total net sales 220,747 $ 53,768 274,515 213,883 $ 46,291 260,174 225,847 39,748 265,595 Cost of sales: Products Services Total cost of sales Gross margin 151,286 18.273 169,559 104,956 144,996 16,786 161,782 98,392 148,164 15,592 163,756 101,839 Operating expenses: Research and development Selling, general and administrative Total operating expenses 18,752 19,916 38,668 16,217 18,245 34,462 14,236 16,705 30,941 Operating income Other income/(expense), net Income before provision for income taxes Provision for income taxes 66,288 803 67,091 9.680 57,411 $ 63,930 1,807 65.737 10,481 55,256 $ 70,898 2.005 72,903 13,372 59,531 Net income $ Eamings per share: Basic Diluted $ $ $ 3.31 $ 3.28 $ 2.99 2.97 3.00 2.98 $ Shares used in computing earnings per share: Basic Diluted 17,352,119 17,528,214 18,471,336 18,595,651 19,821,510 20,000,435 Apple Inc. CONSOLIDATED STATEMENTS OF COMPREHENSIVE INCOME (In millions) Years ended September 26, September 28, September 29, 2020 2018 $ 57,411 $ 55,256 $ 59,531 2019 Net income Other comprehensive income/loss): Change in foreign currency translation, net of tax 88 (408) (525) 79 (661) 523 Change in unrealized gains/losses on derivative instruments, net of tax: Change in fair value of derivatives Adjustment for net (gains) losses realized and included in net income Total change in unrealized gains/losses on derivative instruments (1,264) 23 382 (1,185) (638) 905 1,202 3,802 (3,407) Change in unrealized gains/losses on marketable debt securities, net of tax: Change in fair value of marketable debt securities Adjustment for net (gains)/losses realized and included in net income Total change in unrealized gains/losses on marketable debt securities (63) 25 1 1,139 3,827 (3,406) Total other comprehensive income/(loss) Total comprehensive income 42 57,453 $ 2,781 58,037 $ (3,026) 56,505 $ Apple Inc. CONSOLIDATED BALANCE SHEETS (In millions, except number of shares which are reflected in thousands and par value) September 26, 2020 September 28, 2019 ASSETS: $ $ 38,016 52,927 Current assets: Cash and cash equivalents Marketable securities Accounts receivable, net Inventories Vendor non-trade receivables Other current assets Total current assets 16,120 4,061 21,325 11,264 143,713 48,844 51,713 22,926 4,106 22,878 12,352 162,819 Non-current assets: Marketable securities Property, plant and equipment, net Other non-current assets Total non-current assets Total assets 100,887 36,766 42,522 180, 175 323,888 $ 105,341 37,378 32,978 175,697 338,516 $ LIABILITIES AND SHAREHOLDERS' EQUITY: $ $ Current liabilities: Accounts payable Other current liabilities Deferred revenue Commercial paper Term debt Total current liabilities 42,296 42,684 6,643 4,996 8,773 105,392 46,236 37,720 5,522 5,980 10,260 105,718 Non-current liabilities: Term debt Other non-current liabilities Total non-current liabilities Total liabilities 98,667 54,490 153,157 258,549 91,807 50,503 142,310 248,028 Commitments and contingencies Shareholders' equity: Common stock and additional paid-in capital, $0.00001 par value: 50,400,000 shares authorized; 16,976,763 and 17,772,945 shares issued and outstanding, respectively Retained earnings Accumulated other comprehensive income/(loss) Total shareholders' equity Total liabilities and shareholders' equity 50,779 14,966 (406) 65,339 323,888 45,174 45,898 (584) 90,488 338,516 $ Apple Inc. CONSOLIDATED STATEMENTS OF CASH FLOWS (In millions) September 26, 2020 Years ended September 28, 2019 25,913 September 29, 2018 20,289 $ 50,224 57,411 55,256 59,531 12,547 10,903 11,056 6,829 (215) (97) 6,068 (340) (652) 5,340 (32,590) (444) 245 (5,322) 828 (8,010) 6,917 (127) 1,553 (9,588) (4,062) 2,081 (423) (289) 2,931 873 (1,923) (625) (4,700) 69,391 9,175 (3) 8,916 80,674 38,449 77,434 Cash, cash equivalents and restricted cash, beginning balances Operating activities: Net income Adjustments to reconcile net income to cash generated by operating activities: Depreciation and amortization Share-based compensation expense Deferred income tax benefit Other Changes in operating assets and liabilities: Accounts receivable, net Inventories Vendor non-trade receivables Other current and non-current assets Accounts payable Deferred revenue Other current and non-current liabilities Cash generated by operating activities Investing activities: Purchases of marketable securities Proceeds from maturities of marketable securities Proceeds from sales of marketable securities Payments for acquisition of property, plant and equipment Payments made in connection with business acquisitions, net Purchases of non-marketable securities Proceeds from non-marketable securities Other Cash generated by/(used in) investing activities Financing activities: Proceeds from issuance of common stock Payments for taxes related to net share settlement of equity awards Payments for dividends and dividend equivalents Repurchases of common stock Proceeds from issuance of term debt, net Repayments of term debt Repayments of commercial paper, net (114,938) 69,918 50,473 (7.309) (1,524) (210) 92 (791) (4,289) (39,630) 40,102 56,988 (10,495) (624) (1,001) 1,634 (1,078) 45,896 (71,356) 55,881 47,838 (13,313) (721) (1,871) 353 (745) 16,066 880 781 (3,634) (14,081) (72,358) 16,091 (12,629) (963) (126) (86,820) (2,817) (14,119) (66,897) 6,963 (8,805) (5,977) (105) (90,976) 669 (2,527) (13,712) (72,738) 6,969 (6,500) (37) Other (87,876) 5,624 (10,435) 39,789 24,311 50,224 $ 25,913 Cash used in financing activities Increase/(Decrease) in cash, cash equivalents and restricted cash Cash, cash equivalents and restricted cash, ending balances Supplemental cash flow disclosure: Cash paid for income taxes, net Cash paid for interest $ $ $ 9,501 3,002 15,263 $ 3,423 $ 10,417 3,022 $ Apple Inc. CONSOLIDATED STATEMENTS OF SHAREHOLDERS' EQUITY (In millions, except per share amounts) Years ended September 26, September 28, September 29, 2020 2019 2018 $ 90,488 $ 107,147 $ 134,047 Total shareholders' equity, beginning balances 40,201 45,174 880 35,867 669 781 Common stock and additional paid-in capital: Beginning balances Common stock issued Common stock withheld related to net share settlement of equity awards Share-based compensation Ending balances (2,250) 6,975 (2,002) 6,194 45,174 (1.778) 5,443 50,779 40,201 45,898 57,411 (14,087) 70,400 55,256 (14,129) 98,330 59,531 (13,735) Retained earnings: Beginning balances Net income Dividends and dividend equivalents declared Common stock withheld related to net share settlement of equity awards Common stock repurchased Cumulative effects of changes in accounting principles Ending balances (1,604) (72,516) (136) 14,966 (1,029) (67,101) 2,501 45,898 (948) (73,056) 278 70,400 (584) Accumulated other comprehensive income/(loss): Beginning balances Other comprehensive income/loss) Cumulative effects of changes in accounting principles Ending balances 42 136 (3,454) 2,781 89 (584) (150) (3,026) (278) (3,454) (406) Total shareholders' equity, ending balances $ 65,339 $ 90,488 $ 107,147 Dividends and dividend equivalents declared per share or RSU $ 0.795 $ 0.75 $ 0.68 Apple Inc. CONSOLIDATED STATEMENTS OF OPERATIONS (In millions, except number of shares which are reflected in thousands and per share amounts) Years ended September 26, 2020 September 28, 2019 September 29, 2018 $ Net sales: Products Services Total net sales 220,747 $ 53,768 274,515 213,883 $ 46,291 260,174 225,847 39,748 265,595 Cost of sales: Products Services Total cost of sales Gross margin 151,286 18.273 169,559 104,956 144,996 16,786 161,782 98,392 148,164 15,592 163,756 101,839 Operating expenses: Research and development Selling, general and administrative Total operating expenses 18,752 19,916 38,668 16,217 18,245 34,462 14,236 16,705 30,941 Operating income Other income/(expense), net Income before provision for income taxes Provision for income taxes 66,288 803 67,091 9.680 57,411 $ 63,930 1,807 65.737 10,481 55,256 $ 70,898 2.005 72,903 13,372 59,531 Net income $ Eamings per share: Basic Diluted $ $ $ 3.31 $ 3.28 $ 2.99 2.97 3.00 2.98 $ Shares used in computing earnings per share: Basic Diluted 17,352,119 17,528,214 18,471,336 18,595,651 19,821,510 20,000,435 Apple Inc. CONSOLIDATED STATEMENTS OF COMPREHENSIVE INCOME (In millions) Years ended September 26, September 28, September 29, 2020 2018 $ 57,411 $ 55,256 $ 59,531 2019 Net income Other comprehensive income/loss): Change in foreign currency translation, net of tax 88 (408) (525) 79 (661) 523 Change in unrealized gains/losses on derivative instruments, net of tax: Change in fair value of derivatives Adjustment for net (gains) losses realized and included in net income Total change in unrealized gains/losses on derivative instruments (1,264) 23 382 (1,185) (638) 905 1,202 3,802 (3,407) Change in unrealized gains/losses on marketable debt securities, net of tax: Change in fair value of marketable debt securities Adjustment for net (gains)/losses realized and included in net income Total change in unrealized gains/losses on marketable debt securities (63) 25 1 1,139 3,827 (3,406) Total other comprehensive income/(loss) Total comprehensive income 42 57,453 $ 2,781 58,037 $ (3,026) 56,505 $ Apple Inc. CONSOLIDATED BALANCE SHEETS (In millions, except number of shares which are reflected in thousands and par value) September 26, 2020 September 28, 2019 ASSETS: $ $ 38,016 52,927 Current assets: Cash and cash equivalents Marketable securities Accounts receivable, net Inventories Vendor non-trade receivables Other current assets Total current assets 16,120 4,061 21,325 11,264 143,713 48,844 51,713 22,926 4,106 22,878 12,352 162,819 Non-current assets: Marketable securities Property, plant and equipment, net Other non-current assets Total non-current assets Total assets 100,887 36,766 42,522 180, 175 323,888 $ 105,341 37,378 32,978 175,697 338,516 $ LIABILITIES AND SHAREHOLDERS' EQUITY: $ $ Current liabilities: Accounts payable Other current liabilities Deferred revenue Commercial paper Term debt Total current liabilities 42,296 42,684 6,643 4,996 8,773 105,392 46,236 37,720 5,522 5,980 10,260 105,718 Non-current liabilities: Term debt Other non-current liabilities Total non-current liabilities Total liabilities 98,667 54,490 153,157 258,549 91,807 50,503 142,310 248,028 Commitments and contingencies Shareholders' equity: Common stock and additional paid-in capital, $0.00001 par value: 50,400,000 shares authorized; 16,976,763 and 17,772,945 shares issued and outstanding, respectively Retained earnings Accumulated other comprehensive income/(loss) Total shareholders' equity Total liabilities and shareholders' equity 50,779 14,966 (406) 65,339 323,888 45,174 45,898 (584) 90,488 338,516 $ Apple Inc. CONSOLIDATED STATEMENTS OF CASH FLOWS (In millions) September 26, 2020 Years ended September 28, 2019 25,913 September 29, 2018 20,289 $ 50,224 57,411 55,256 59,531 12,547 10,903 11,056 6,829 (215) (97) 6,068 (340) (652) 5,340 (32,590) (444) 245 (5,322) 828 (8,010) 6,917 (127) 1,553 (9,588) (4,062) 2,081 (423) (289) 2,931 873 (1,923) (625) (4,700) 69,391 9,175 (3) 8,916 80,674 38,449 77,434 Cash, cash equivalents and restricted cash, beginning balances Operating activities: Net income Adjustments to reconcile net income to cash generated by operating activities: Depreciation and amortization Share-based compensation expense Deferred income tax benefit Other Changes in operating assets and liabilities: Accounts receivable, net Inventories Vendor non-trade receivables Other current and non-current assets Accounts payable Deferred revenue Other current and non-current liabilities Cash generated by operating activities Investing activities: Purchases of marketable securities Proceeds from maturities of marketable securities Proceeds from sales of marketable securities Payments for acquisition of property, plant and equipment Payments made in connection with business acquisitions, net Purchases of non-marketable securities Proceeds from non-marketable securities Other Cash generated by/(used in) investing activities Financing activities: Proceeds from issuance of common stock Payments for taxes related to net share settlement of equity awards Payments for dividends and dividend equivalents Repurchases of common stock Proceeds from issuance of term debt, net Repayments of term debt Repayments of commercial paper, net (114,938) 69,918 50,473 (7.309) (1,524) (210) 92 (791) (4,289) (39,630) 40,102 56,988 (10,495) (624) (1,001) 1,634 (1,078) 45,896 (71,356) 55,881 47,838 (13,313) (721) (1,871) 353 (745) 16,066 880 781 (3,634) (14,081) (72,358) 16,091 (12,629) (963) (126) (86,820) (2,817) (14,119) (66,897) 6,963 (8,805) (5,977) (105) (90,976) 669 (2,527) (13,712) (72,738) 6,969 (6,500) (37) Other (87,876) 5,624 (10,435) 39,789 24,311 50,224 $ 25,913 Cash used in financing activities Increase/(Decrease) in cash, cash equivalents and restricted cash Cash, cash equivalents and restricted cash, ending balances Supplemental cash flow disclosure: Cash paid for income taxes, net Cash paid for interest $ $ $ 9,501 3,002 15,263 $ 3,423 $ 10,417 3,022 $
Step by Step Solution
There are 3 Steps involved in it

Get step-by-step solutions from verified subject matter experts