

Question: To determine if their 2.33 centimeter casting are properly adjusted, Smith & Johnson Industries has decided to us an x chart which used the range
To determine if their 2.33 centimeter casting are properly adjusted, Smith & Johnson Industries has decided to us an x chart which used the range to estimate the variability in the sample. Step 2 of 7: What is the Upper Control Limit? Round your answer to three decimal places.Step 3 of 7: What is the Lower Control Limit? Round your answer to three decimal places.
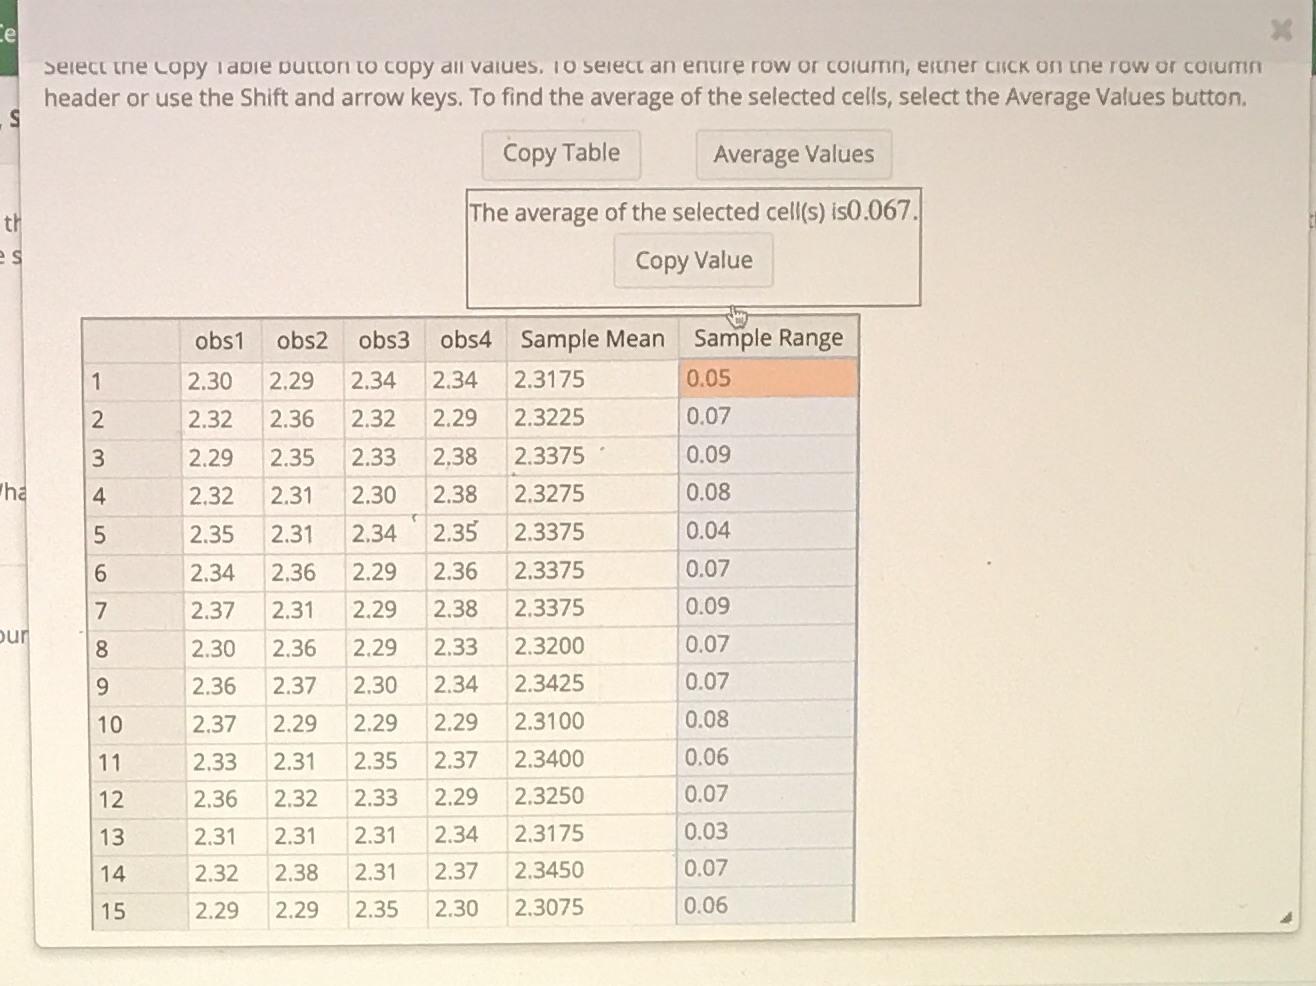
e Select the copy l able button to copy all values. to select an entire row or column, einer click on the row or column header or use the Shift and arrow keys. To find the average of the selected cells, select the Average Values button. Copy Table Average Values The average of the selected cell(s) is0.067. Copy Value obs1 obs2 obs3 obs4 Sample Mean Sample Range 2.30 2.29 2.34 2.34 2.3175 0.05 2.32 2.36 2.32 2.29 2.3225 0.07 - W N 2.29 2.35 2.33 2.38 2.3375 0.09 ha 2.32 2.31 2.30 2.38 2.3275 0.08 5 2.35 2.31 2.34 2.35 2.3375 0.04 6 2.34 2.36 2.29 2.36 2.3375 0.07 2.37 2.31 2.29 2.38 2.3375 0.09 our 8 2.30 2.36 2.29 2.33 2.3200 0.07 9 2.36 2.37 2.30 2.34 2.3425 0.07 10 2.37 2.29 2.29 2.29 2.3100 0.08 11 2.33 2.31 2.35 2.37 2.3400 0.06 12 2.36 2.32 2.33 2.29 2.3250 0.07 13 2.31 2.31 2.31 2.34 2.3175 0.03 14 2.32 2.38 2.31 2.37 2.3450 0.07 15 2.29 2.29 2.35 2.30 2.3075 0.06
Step by Step Solution
There are 3 Steps involved in it

Get step-by-step solutions from verified subject matter experts