

Question: To finish this project, use the data set using ANOVA to compare the means of four groups. First, as in the first class activity, complete
To finish this project, use the data set using ANOVA to compare the means of four groups.
First, as in the first class activity, complete descriptive statistics.
Plots histograms and box plots for four groups, then calculates mean, median, and standard deviation for each group, then tabulates the results.
Explain any outliers and box plot shapes.
Write appropriate null and alternative hypothesis tests to compare four groups in the inferential statistics section.
Then, using Excel, perform an ANOVA as instructed in class, locate the f table, calculate the P-value, and compare it to the alpha = 0.05 of the comparison.
Then come to a decision.
use this data
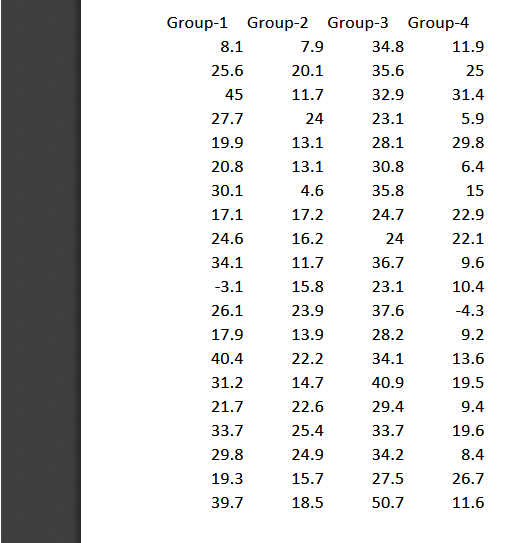
Group-1 Group-2 Group-3 Group-4 8.1 7.9 34.8 11.9 25.6 20.1 35.6 25 45 11.7 32.9 31.4 27.7 24 23.1 5.9 19.9 13.1 28.1 29.8 20.8 13.1 30.8 6.4 30.1 4.6 35.8 15 17.1 17.2 24.7 22.9 24.6 16.2 24 22.1 34.1 11.7 36.7 9.6 -3.1 15.8 23.1 10.4 26.1 23.9 37.6 4.3 17.9 13.9 28.2 9.2 40.4 22.2 34.1 13.6 31.2 14.7 40.9 19.5 21.7 22.6 29.4 9.4 33.7 25.4 33.7 19.6 29.8 24.9 34.2 8.4 19.3 15.7 27.5 26.7 39.7 18.5 50.7 11.6
Step by Step Solution
There are 3 Steps involved in it

Get step-by-step solutions from verified subject matter experts