

Question: To get dataset: In R or RStudio's command line, type in the following: install.packages(carData) library(carData) Name Data Package Data set name in R Description of
To get dataset: In R or RStudio's command line, type in the following:
install.packages("carData")
library(carData)
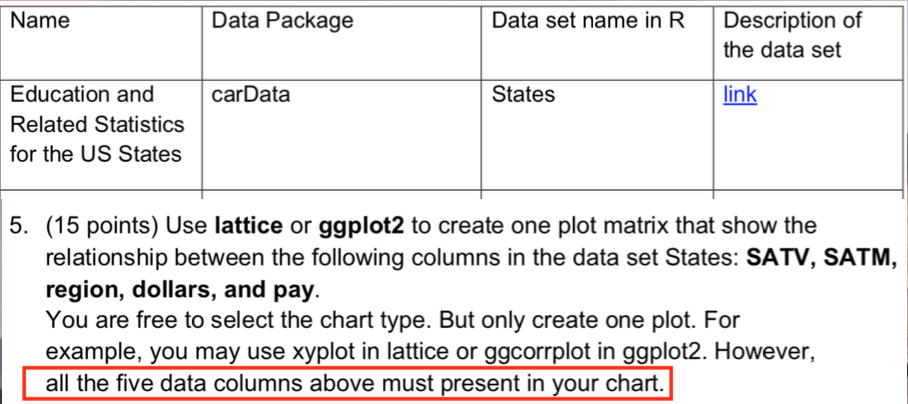
Name Data Package Data set name in R Description of the data set Education and carData Related Statistics for the US States States link 5. (15 points) Use lattice or ggplot2 to create one plot matrix that show the relationship between the following columns in the data set States: SATV, SATM, region, dollars, and pay. You are free to select the chart type. But only create one plot. For example, you may use xyplot in lattice or ggcorrplot in ggplot2. However, all the five data columns above must present in your chart. Name Data Package Data set name in R Description of the data set Education and carData Related Statistics for the US States States link 5. (15 points) Use lattice or ggplot2 to create one plot matrix that show the relationship between the following columns in the data set States: SATV, SATM, region, dollars, and pay. You are free to select the chart type. But only create one plot. For example, you may use xyplot in lattice or ggcorrplot in ggplot2. However, all the five data columns above must present in your chart
Step by Step Solution
There are 3 Steps involved in it

Get step-by-step solutions from verified subject matter experts