

Question: To make a graph, copy data as needed to the unlocked page (starting at row 50). Use Paste Values. Sign Repair Price Deflator for Constant
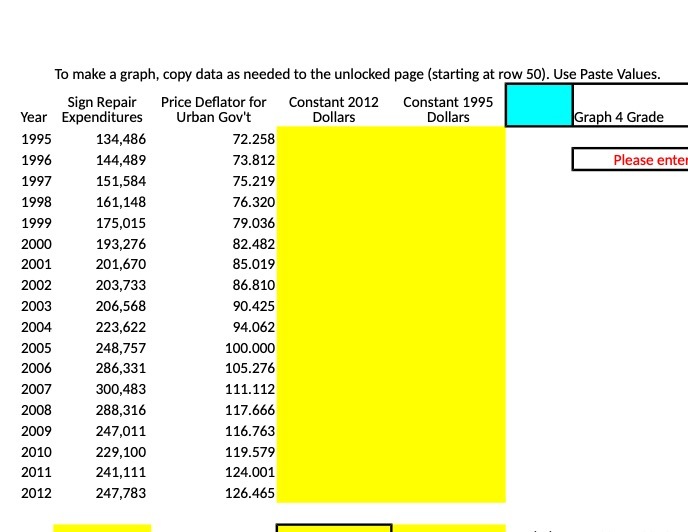
To make a graph, copy data as needed to the unlocked page (starting at row 50). Use Paste Values. Sign Repair Price Deflator for Constant 2012 Constant 1995 Year Expenditures Urban Gov't Dollars Dollars Graph 4 Grade 1995 134,486 72.258 1996 144,489 73.812 Please ente 1997 151,584 75.219 1998 161,148 76.320 1999 175,015 79.036 2000 193,276 82.482 2001 201,670 85.019 2002 203,733 86.810 2003 206,568 90.425 2004 223,622 94.062 2005 248,757 100.000 2006 286,331 105.276 2007 300,483 111.112 2008 288,316 117.666 2009 247,011 116.763 2010 229,100 119.579 2011 241,111 124.001 2012 247,783 126.465
Step by Step Solution
There are 3 Steps involved in it
1 Expert Approved Answer
Step: 1 Unlock

Question Has Been Solved by an Expert!
Get step-by-step solutions from verified subject matter experts
Step: 2 Unlock
Step: 3 Unlock