

Question: To make raw predictions for the criterion variable, will i need to use the chart above? I feel like this question lacks information and i'm
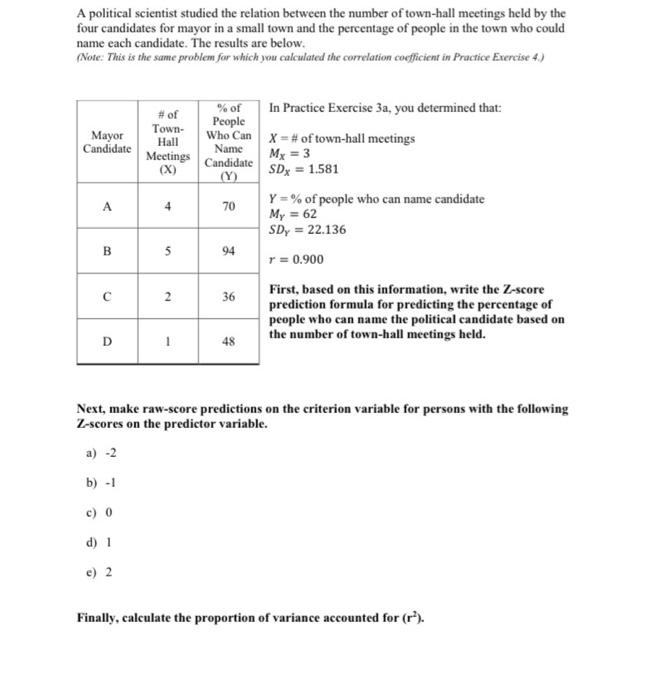
A political scientist studied the relation between the number of town hall meetings held by the four candidates for mayor in a small town and the percentage of people in the town who could name each candidate. The results are below. (Note: This is the same problem for which you calculated the correlation coefficient in Practice Exercise 4) Mayor Candidate # of Town- Hall Meetings (X) % of In Practice Exercise 3a, you determined that: People Who Can x = # of town-hall meetings Name Mx = 3 Candidate (Y) SDx = 1.581 Y =% of people who can name candidate My = 62 SDy = 22.136 94 r = 0.900 A 4 70 B 5 2 36 First, based on this information, write the Z-score prediction formula for predicting the percentage of people who can name the political candidate based on the number of town-hall meetings held. D 48 Next, make raw-score predictions on the criterion variable for persons with the following Z-scores on the predictor variable. a) -2 b) - 1 c) 0 d) 1 e) 2 Finally, calculate the proportion of variance accounted for (r)
Step by Step Solution
There are 3 Steps involved in it

Get step-by-step solutions from verified subject matter experts