

Question: To set up the machine and to create a control chart to be used throughout the run, 1 5 samples were taken with four resistors
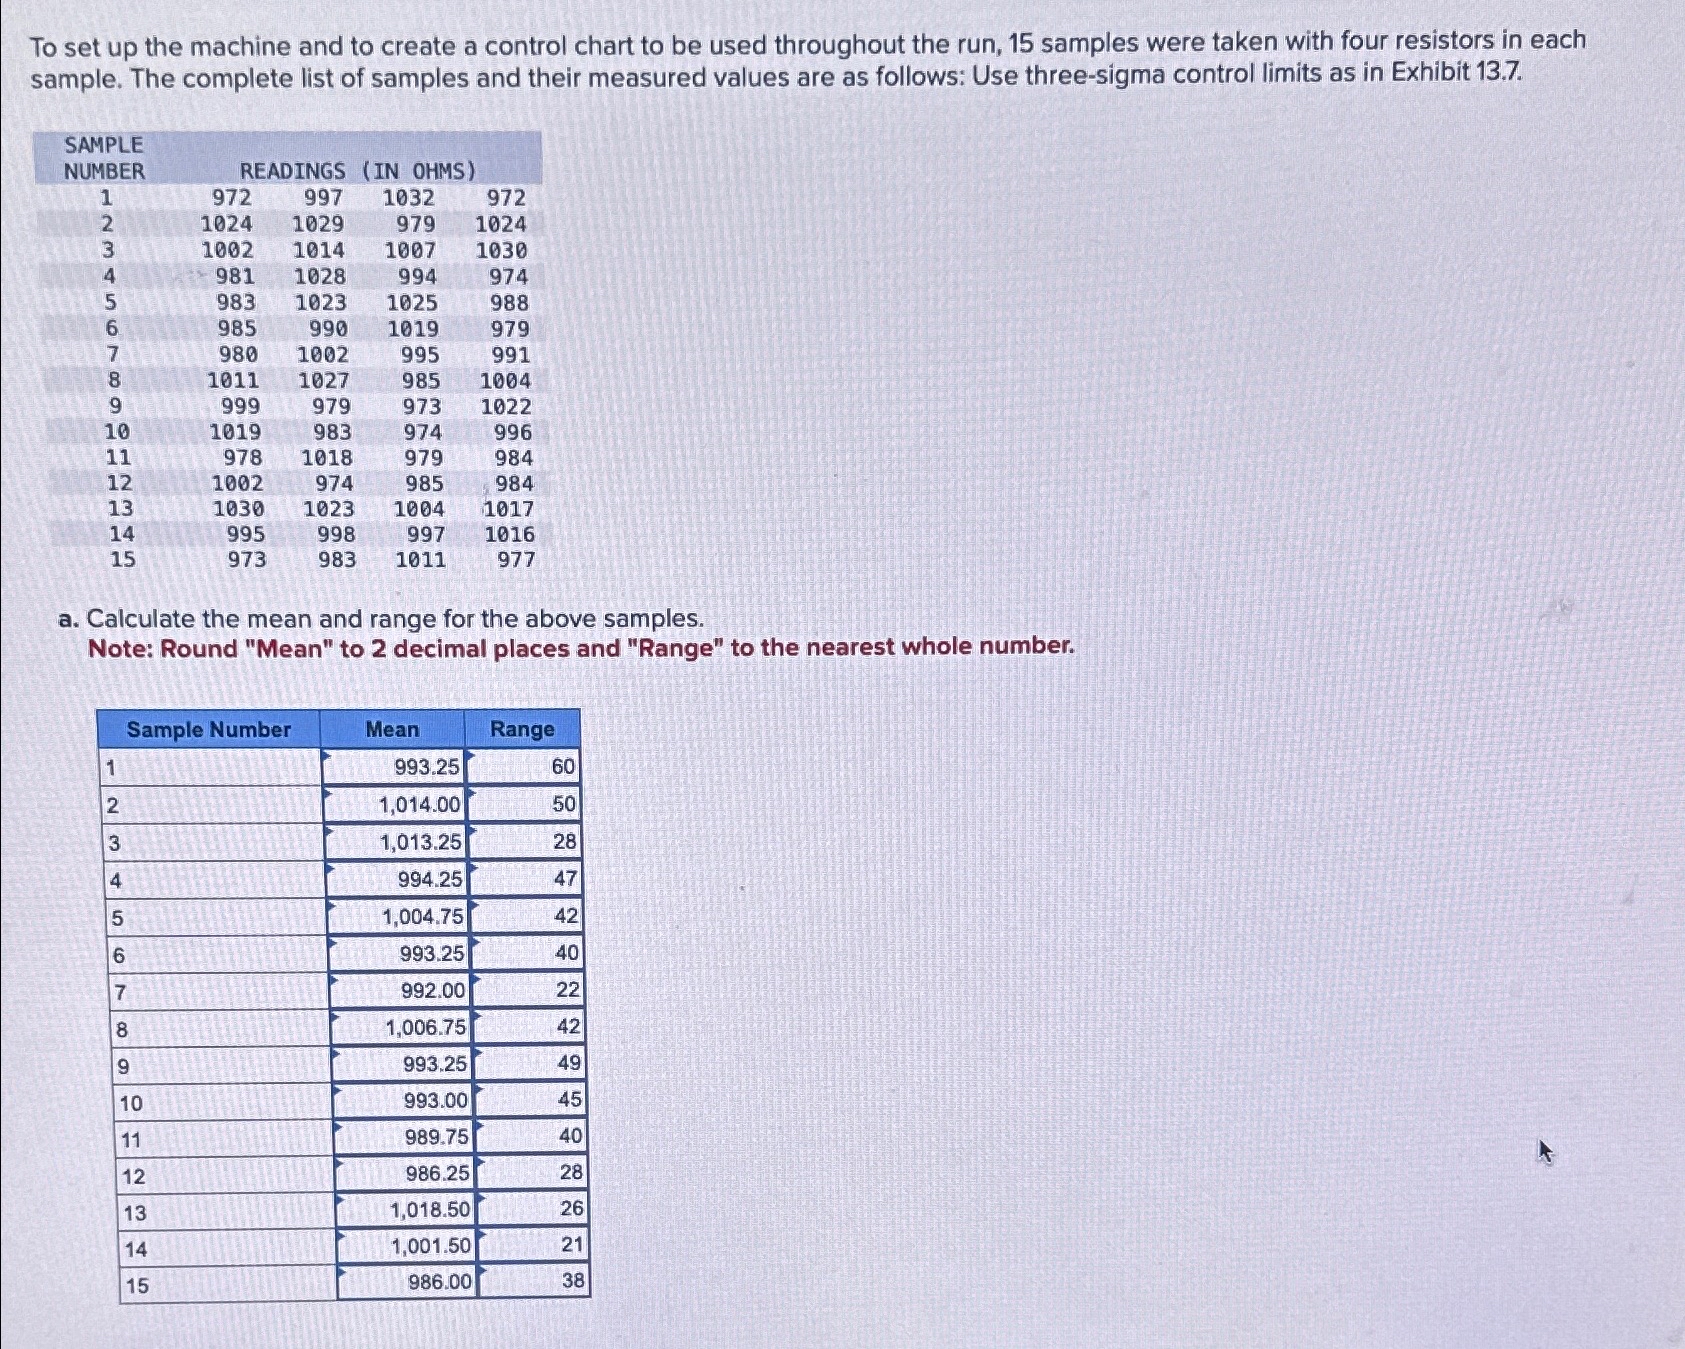
To set up the machine and to create a control chart to be used throughout the run, samples were taken with four resistors in each sample. The complete list of samples and their measured values are as follows: Use threesigma control limits as in Exhibit
tabletableSAMPLENUMBERREADINGS,IN OHMS
a Calculate the mean and range for the above samples.
Note: Round "Mean" to decimal places and "Range" to the nearest whole number.
tableSample Number,Mean,Range
b Determine and
Note: Round your answers to decimal places.
table
Step by Step Solution
There are 3 Steps involved in it
1 Expert Approved Answer
Step: 1 Unlock

Question Has Been Solved by an Expert!
Get step-by-step solutions from verified subject matter experts
Step: 2 Unlock
Step: 3 Unlock