

Question: TO SOLVE WITH R Problem 1: Consider a characteristic whose population is normally distributed with mean 29.3 and standard deviation 9.9. A praticitioner studying this
TO SOLVE WITH R
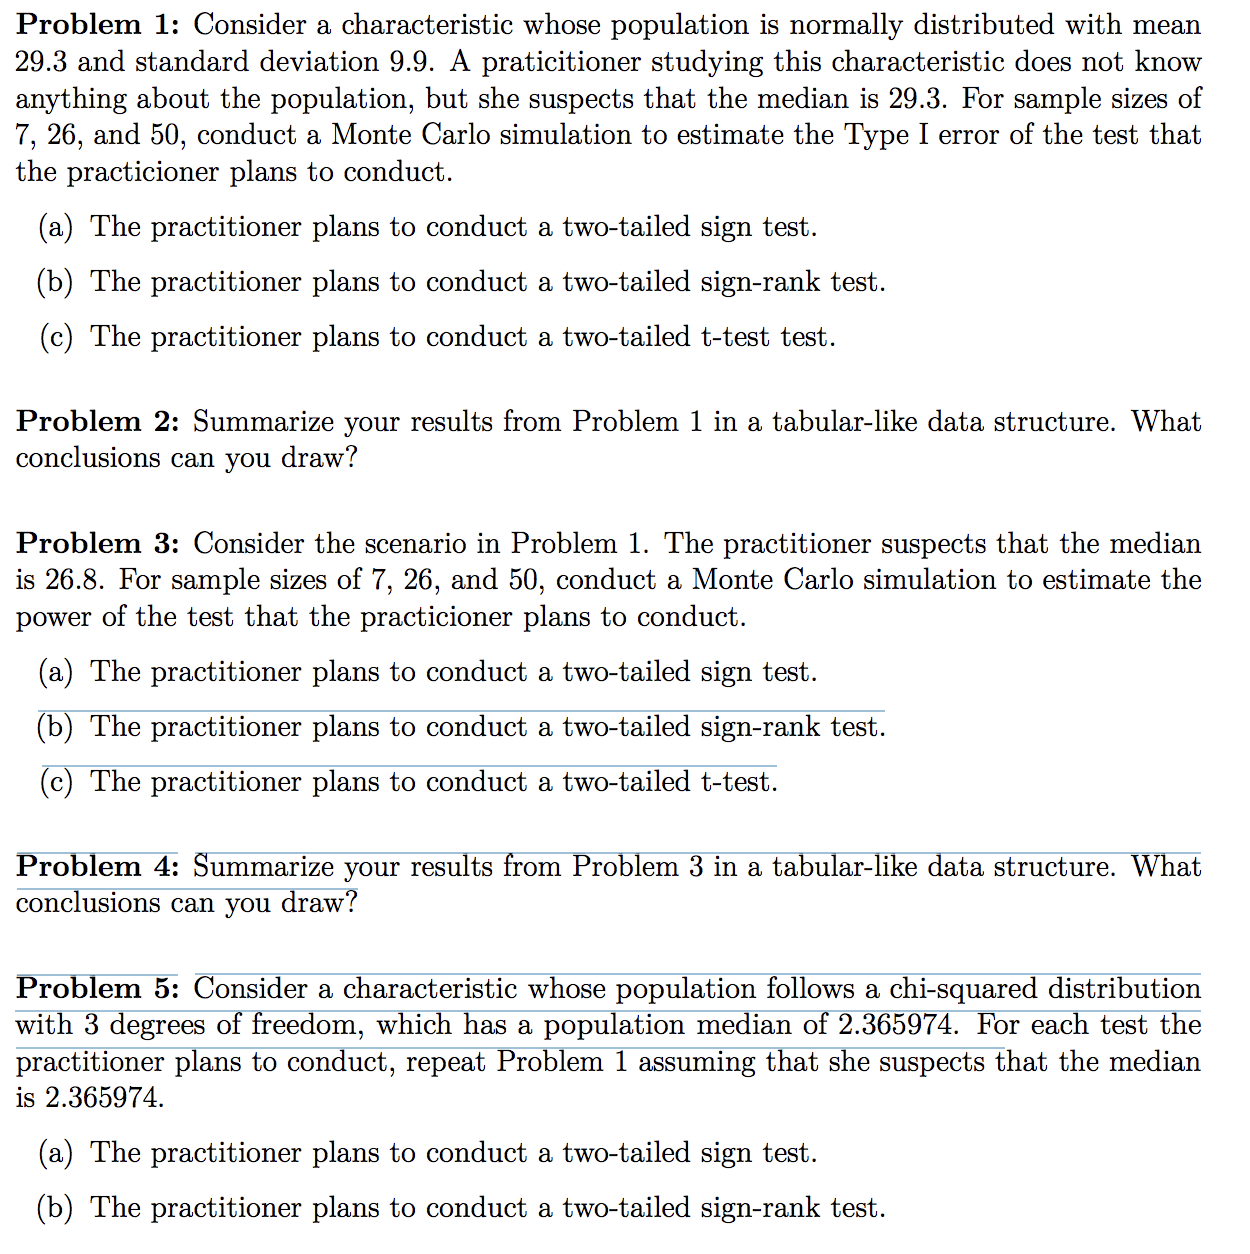
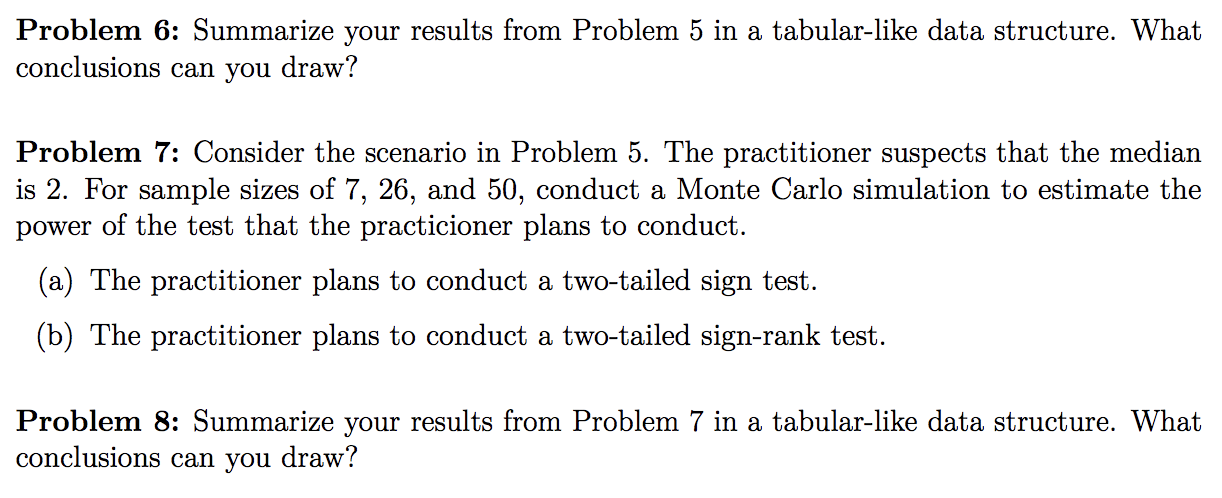
Problem 1: Consider a characteristic whose population is normally distributed with mean 29.3 and standard deviation 9.9. A praticitioner studying this characteristic does not know anything about the population, but she suspects that the median is 29.3. For sample sizes of 7, 26, and 50, conduct a Monte Carlo simulation to estimate the Type I error of the test that the practicioner plans to conduct. (a) The practitioner plans to conduct a twotailed sign test. (b) The practitioner plans to conduct a twotailed sign-rank test. (0) The practitioner plans to conduct a twotailed t-test test. Problem 2: Summarize your results from Problem 1 in a tabularlike data structure. What conclusions can you draw? Problem 3: Consider the scenario in Problem 1. The practitioner suspects that the median is 26.8. For sample sizes of 7, 26, and 50, conduct a Monte Carlo simulation to estimate the power of the test that the practicioner plans to conduct. (a) The practitioner plans to conduct a twotailed sign test. (b) The practitioner plans to conduct a twotailed signrank test. (0) The practitioner plans to conduct a twotailed ttest. Problem 4: Summarize your results from Problem 3 in a tahuiarliEe data structure. What conclusions can you draw? Problem 5: Consider a characteristic whose population follows a chisquared distribution with 3 degrees of Eeedom, which has a population median of 2.365974. For each test the practitioner plans to conduct, repeat Prohlem 1 assuming that she suspects that the median is 2.365974. (a) The practitioner plans to conduct a twotailed sign test. (b) The practitioner plans to conduct a twotailed sign-rank test. Problem 6: Summarize your results from Problem 5 in a tabularlike data structure. What conclusions can you draw? Problem 7: Consider the scenario in Problem 5. The practitioner suspects that the median is 2. For sample sizes of 7, 26, and 50, conduct a Monte Carlo simulation to estimate the power of the test that the practicioner plans to conduct. (a) The practitioner plans to conduct a twotailed sign test. (b) The practitioner plans to conduct a twotailed sign-rank test. Problem 8: Summarize your results from Problem 7 in a tabularlike data structure. What conclusions can you draw
Step by Step Solution
There are 3 Steps involved in it

Get step-by-step solutions from verified subject matter experts