

Question: To start this assignment, let's run a chi-square test in SPSS. Let's imagine that you are interested in political party affiliation. The first step in
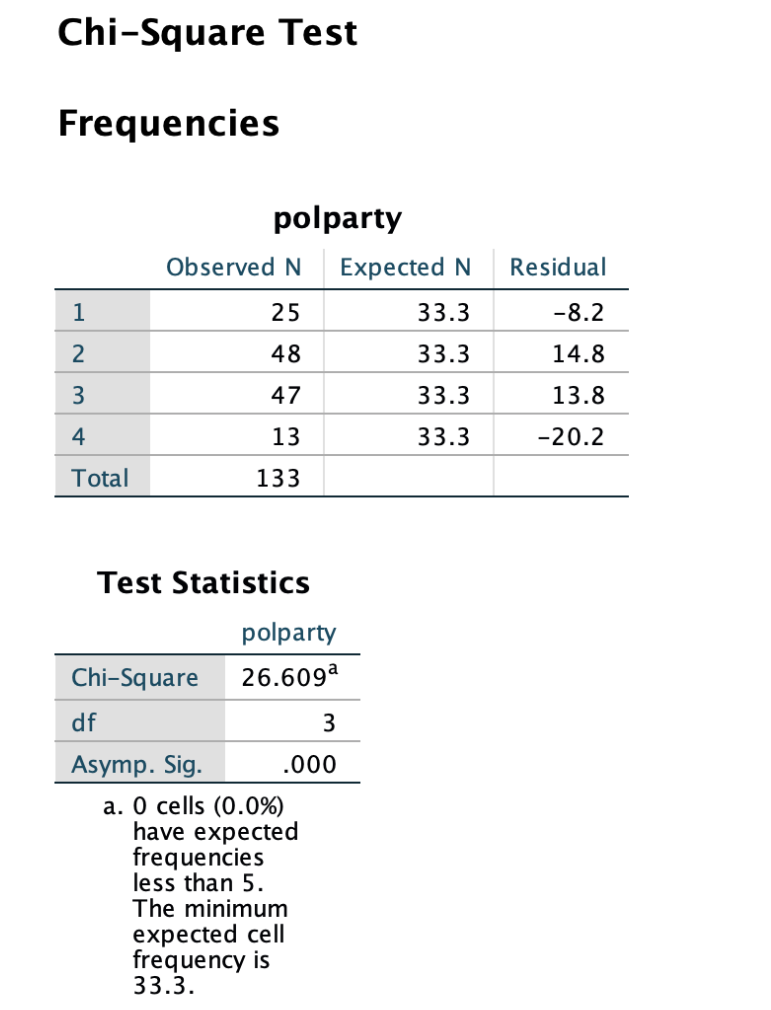
To start this assignment, let's run a chi-square test in SPSS. Let's imagine that you are interested in political party affiliation. The first step in your research study is to determine whether political party affiliation is equally distributed across all possible categories in your data, including:
1 = Republican
2 = Democrat
3 = Independent
4 = Other
To answer this question, run a one-way chi-square test in SPSS using the "polparty" variable. Based on the results of the analysis, what is your obtained chi-square test statistic? Enter your answer rounded to three decimal places (i.e., 10.001, not 10, not 10.1, not 10.01).
What are the degrees of freedom for the chi-square test conducted in Question #1? Enter your answer as a whole number with no decimal places (i.e., 10, not 10.1, not 10.01)
What can you conclude from the chi-square test that you conducted in Question #1?
- Reject the null hypothesis; political party affiliation is not equally distributed across all possible options.
- Fail to reject the null hypothesis; political party affiliation is not equally distributed across all possible options.
- Fail to reject the null hypothesis; political party affiliation is equally distributed across all possible options.
- Reject the null hypothesis; political party affiliation is equally distributed across all possible options.
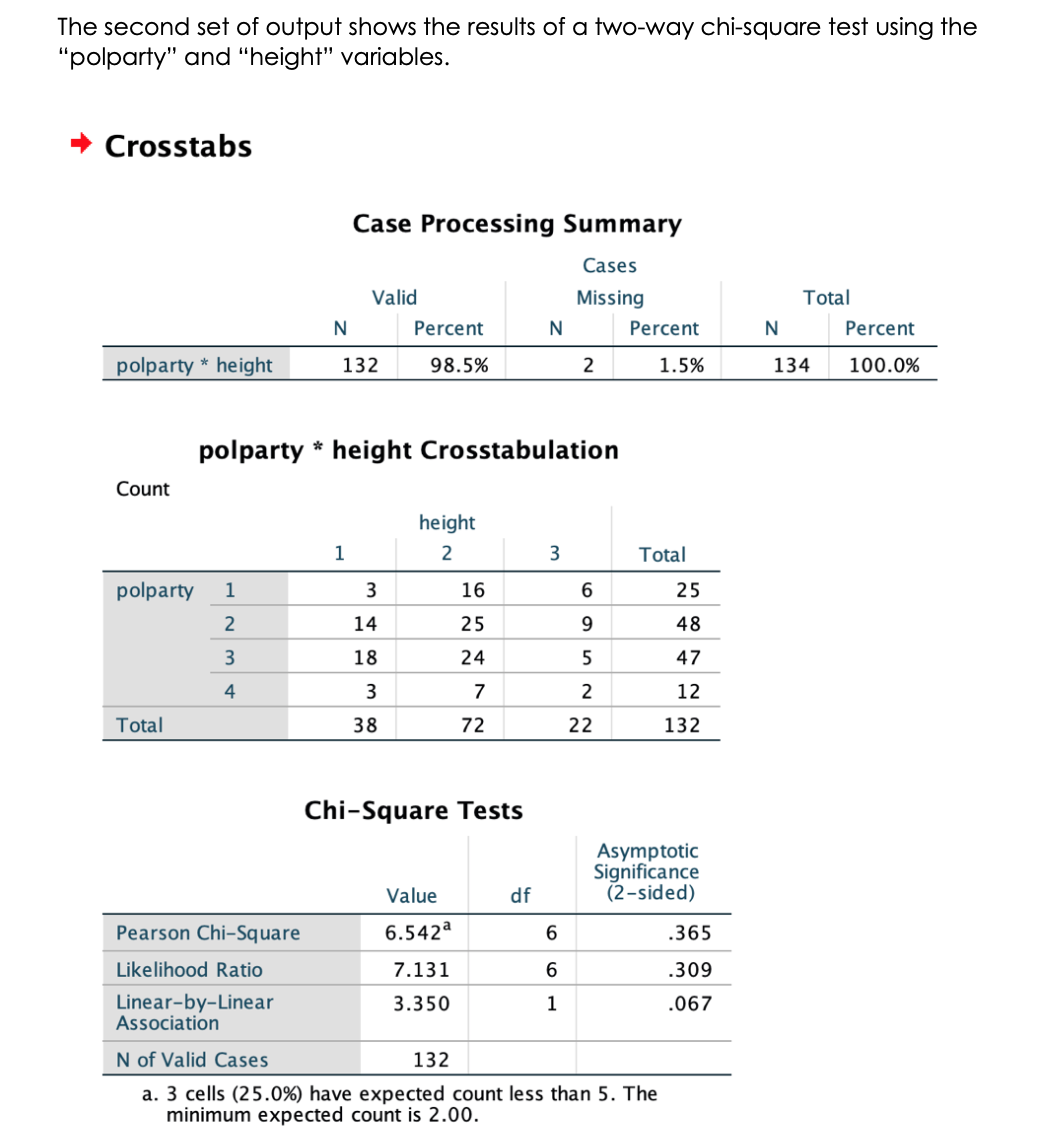
Next, let's imagine that you want to examine whether the pattern of frequencies across the political party affiliation options is the same for people who are short, average, or tall in height (1=short, 2=average, 3=tall). To test this research question, you are going to run a two-way chi-square test with the variables "height" and "polparty". When you run the analysis, make sure to select the necessary options in the main dialogue box and the smaller menu. It does not matter which variable is placed in the columns vs. the rows.
What is the value of the Pearson's chi-square for this test? Enter your value rounded to three decimal places (i.e., 10.001, not 10.01, not 10.1, not 10).
What are the degrees of freedom for the two-way chi-square test described in Question #4? Enter your answer as a whole number with no decimal places (i.e., 10, not 10.1, not 10.01)
What is the p-value for the two-way chi-square test described in Question #4? Enter your answer rounded to three decimal places. Do not include a zero to the left of the decimal point (i.e., .001, not 0.001, not .01, not .1).
What can you conclude from the two-way chi-square test that you conducted in Question #4?
- Reject the null hypothesis; the distribution of political affiliation is not the same for all height groups.
- Fail to reject the null hypothesis; the distribution of political affiliation is the same for all height groups.
- Fail to reject the null hypothesis; the distribution of political affiliation is not the same for all height groups.
- Reject the null hypothesis; the distribution of political affiliation is the same for all height group
The results of the two-way chi-square test indicate that the frequencies of the political party affiliation options are equal (i.e., equal numbers of Republicans, Democrats, Independents and other), regardless of a person's height.
Chi-Square Test Frequencies polparty Observed N Expected N Residual 1 25 33.3 -8.2 2 48 33.3 14.8 3 47 33.3 13.8 4 13 33.3 -20.2 Total 133 Test Statistics polparty Chi-Square 26.609a df 3 Asymp. Sig. .000 a. 0 cells (0.0%) have expected frequencies less than 5. The minimum expected cell frequency is 33.3.The second set of output shows the results of a two-way chi-square test using the 'polparty" and "height" variables. Crosstabs Case Processing Summary Cases Valid Missing Total N Percent N Percent N Percent polparty * height 132 98.5% 2 1.5% 134 100.0% polparty * height Crosstabulation Count height 1 2 3 Total polparty 1 3 16 25 2 14 25 48 3 18 24 5 47 4 3 7 2 12 Total 38 72 22 132 Chi-Square Tests Asymptotic Significance Value df (2-sided) Pearson Chi-Square 6.542a 6 365 Likelihood Ratio 7.131 309 Linear-by-Linear 3.350 1 .067 Association N of Valid Cases 132 a. 3 cells (25.0%) have expected count less than 5. The minimum expected count is 2.00
Step by Step Solution
There are 3 Steps involved in it

Get step-by-step solutions from verified subject matter experts