

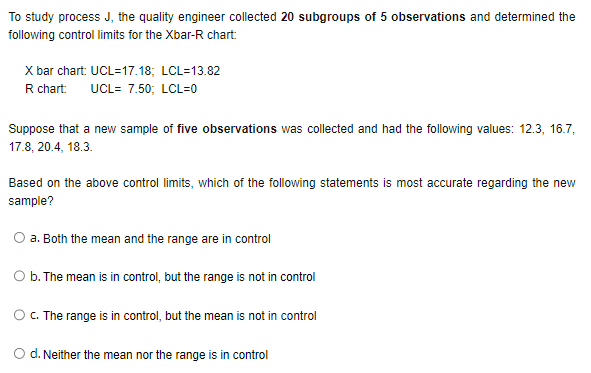
Question: To study process J, the quality engineer collected 20 subgroups of 5 observations and determined the following control limits for the Xbar-R chart: X bar
Step by Step Solution
There are 3 Steps involved in it
1 Expert Approved Answer
Step: 1 Unlock

Question Has Been Solved by an Expert!
Get step-by-step solutions from verified subject matter experts
Step: 2 Unlock
Step: 3 Unlock