

Question: To study the muscle mass decrease with age in women, a nutritionist randomly selected 15 women from each 10-year age group, beginning with age 40
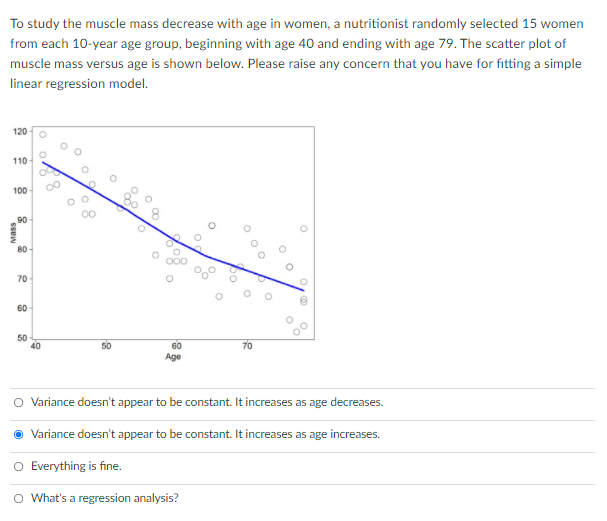
To study the muscle mass decrease with age in women, a nutritionist randomly selected 15 women from each 10-year age group, beginning with age 40 and ending with age 79. The scatter plot of muscle mass versus age is shown below. Please raise any concern that you have for fitting a simple linear regression model. 120 110 100 00 D MOSS O 70 50 40 50 60 70 Age O Variance doesn't appear to be constant. It increases as age decreases. O Variance doesn't appear to be constant. It increases as age increases. O Everything is fine. O What's a regression analysis
Step by Step Solution
There are 3 Steps involved in it
1 Expert Approved Answer
Step: 1 Unlock

Question Has Been Solved by an Expert!
Get step-by-step solutions from verified subject matter experts
Step: 2 Unlock
Step: 3 Unlock