

Question: To test H: p = 20 versus H1: p To test Ho: g = 20 versus HI : g < 20, a simple random sample

To test H\": p = 20 versus H1: p
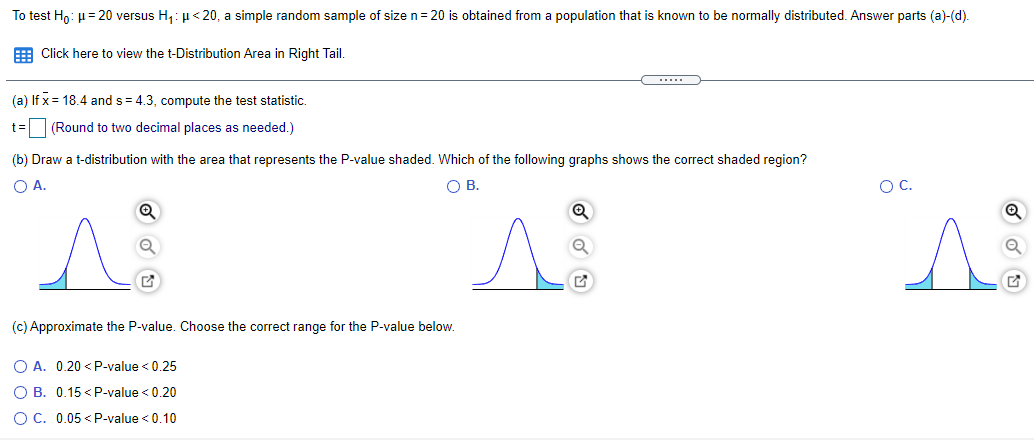
To test Ho: g = 20 versus HI : g < 20, a simple random sample of size n = 20 is obtained from a population that is known to be normally distributed. Answer parts Click here to view the t-Distribution Area in Right Tail (a) Ifx= 18.4 and s = 4.3, compute the test statistic. (Round to two decimal places as needed) (b) Draw a t-distribution with the area that represents the P-value shaded. Which of the following graphs shows the correct shaded region? (c) Approximate the P-value. Choose the correct range for the P-value below. 0.20 < < 025 0.06 <
Step by Step Solution
There are 3 Steps involved in it

Get step-by-step solutions from verified subject matter experts