

Question: Tomework 32 - Section 9.2 question 3, 9.2.17-1 HW Score: 66.67%, 4 of 6 points Part 1 of 6 O Points: 0 of 1 Find
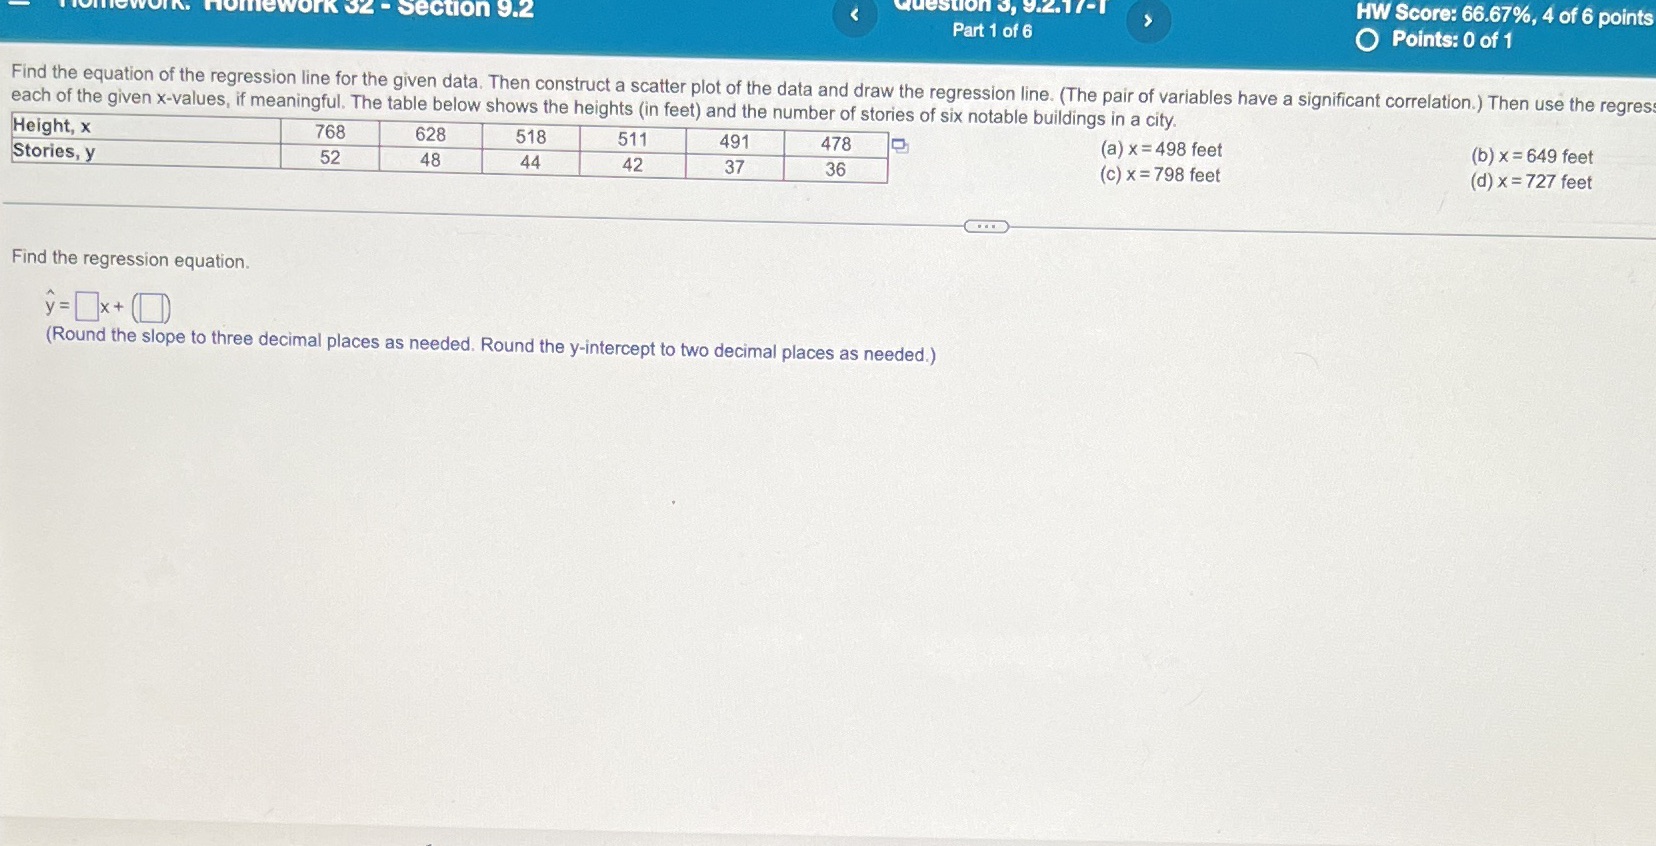
Tomework 32 - Section 9.2 question 3, 9.2.17-1 HW Score: 66.67%, 4 of 6 points Part 1 of 6 O Points: 0 of 1 Find the equation of the regression line for the given data. Then construct a scatter plot of the data and draw the regression line. (The pair of variables have a significant correlation.) Then use the regres each of the given x-values, if meaningful. The table below shows the heights (in feet) and the number of stories of six notable buildings in a city. Height, x 768 628 518 511 491 478 (a) x =498 feet (b) x = 649 feet Stories, y 52 48 44 42 37 36 (c) x = 798 feet (d) x = 727 feet Find the regression equation. y =_x +0 (Round the slope to three decimal places as needed. Round the y-intercept to two decimal places as needed.)
Step by Step Solution
There are 3 Steps involved in it

Get step-by-step solutions from verified subject matter experts