

Question: TOOL NAME Affinity Diagram CYCLE STAGE TOOL NAME Frequency Plots CYCLE STAGE D|M||A||I||C X X X X Brainstorming X X Business Case X FMEA
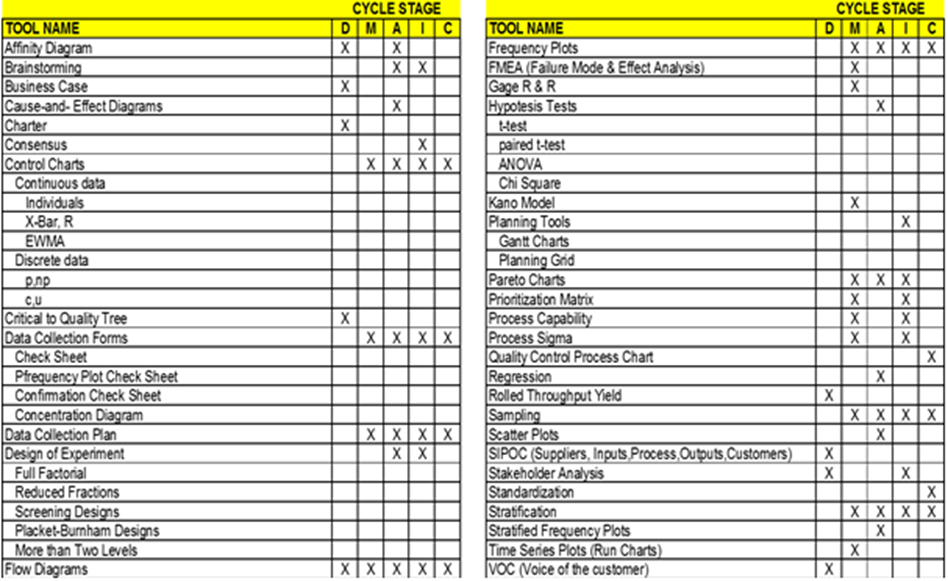
TOOL NAME Affinity Diagram CYCLE STAGE TOOL NAME Frequency Plots CYCLE STAGE D|M||A||I||C X X X X Brainstorming X X Business Case X FMEA (Failure Mode & Effect Analysis) Gage R&R Cause-and-Effect Diagrams Hypotesis Tests X Charter X Consensus X t-test paired t-test Control Charts Continuous data Individuals X-Bar, R Confirmation Check Sheet Concentration Diagram Data Collection Plan Design of Experiment Full Factorial Reduced Fractions Screening Designs Placket-Burnham Designs More than Two Levels Flow Diagrams XXXXX EWMA Discrete data p.p CU Critical to Quality Tree Data Collection Forms Check Sheet Pfrequency Plot Check Sheet X X X X X X X X ANOVA Chi Square Kano Model Planning Tools Gantt Charts Planning Grid Pareto Charts Prioritization Matrix Process Capability Process Sigma Quality Control Process Chart Regression Rolled Throughput Yield Sampling Scatter Plots x X X X X X X X X X X X X X SIPOC (Suppliers, Inputs, Process,Outputs, Customers) Stakeholder Analysis Standardization Stratification Stratified Frequency Plots X X X X X X Time Series Plots (Run Charts) VOC (Voice of the customer) X X X X X
Step by Step Solution
There are 3 Steps involved in it

Get step-by-step solutions from verified subject matter experts