

Question: Tools Data Window Help Excel File Edit AutoSave Home Insert Draw View Insert 5 Page Layout Format 5 : HW Unit 18a Formulas Data Review
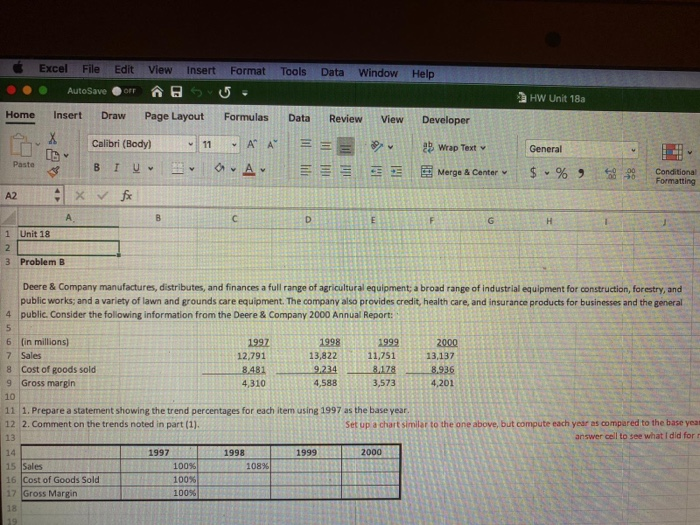
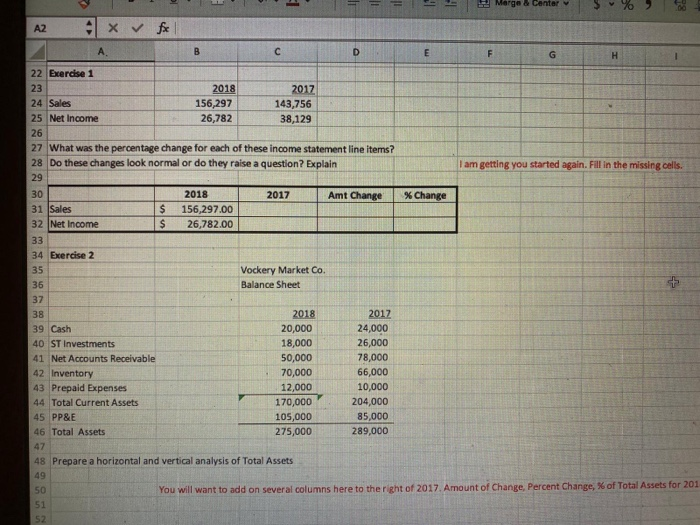
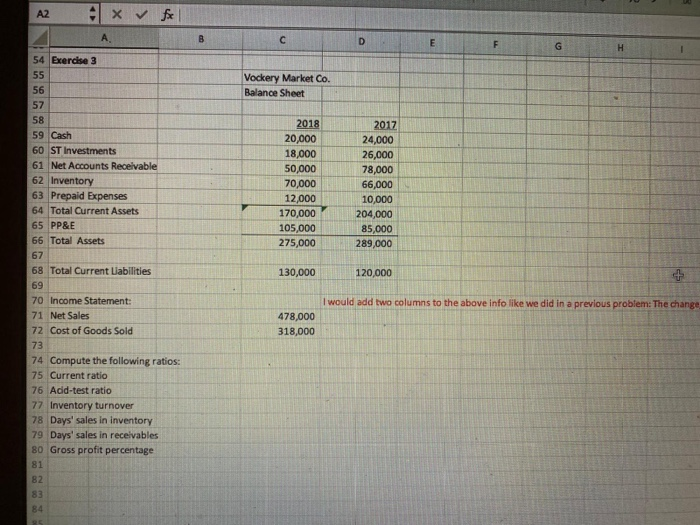
Tools Data Window Help Excel File Edit AutoSave Home Insert Draw View Insert 5 Page Layout Format 5 : HW Unit 18a Formulas Data Review View Developer 11 A = Wrap Text General IS A A Merge & Center $ % 92 Conditional Formatting Calibri (Body) BIU x fx A 1 Unit 18 1 3 Problem B FIGHT Deere & Company manufactures, distributes, and finances a full range of agricultural equipment, a broad range of industrial equipment for construction, forestry, and public works; and a variety of lawn and grounds care equipment. The company also provides credit, health care and insurance products for businesses and the general 4 public. Consider the following information from the Deere & Company 2000 Annual Report: 1998 1 3,822 6 (in millions) 7 Sales 8 Cost of goods sold 9 Gross margin 1997 12,791 8,481 4 310 1999 2000 11,75113,137 3.178 3.573 11 1. Prepare a statement showing the trend percentages for each item using 1997 as the base year. 12 2. Comment on the trends noted in part (1) Set up a chart similar to the one above, but compute each year compared to the base year answer cell to see what I did for 1997 1998 1999 2000 15 Sales 100% 10% 16 Cost of Goods Sold 100% R 1 17 Gross Margin 1 00% = = - Merge & Center 5 % Exerdise 24 Sales 25 Net Income 2018 156,297 26,782 2017 143,756 38,129 27 What was the percentage change for each of these income statement line items? 28 Do these changes look normal or do they raise a question? Explain I am getting you started again. Fill in the missing cells. 2017 Amt Change % Change Sales 32 Net Income $ $ 2018 156,297.00 26,782.00 34 Exercise 2 Vockery Market Co. Balance Sheet 2018 20,000 18,000 39 Cash 40 ST Investments 41 Net Accounts Receivable 42 Inventory 43 Prepaid Expenses 44 Total Current Assets 45 PP&E 46 Total Assets 50,000 70,000 12,000 170,000 105,000 275,000 2017 24,000 26,000 78,000 66,000 10,000 204,000 85,000 289,000 48 Prepare a horizontal and vertical analysis of Total Assets You will want to add on several columns here to the right of 2017. Amount of Change Percent Change of Total Assets for 201 A2 x V fx Vockery Market Co. Balance Sheet 59 Cash 60 ST Investments 61 Net Accounts Receivable 62 Inventory 63 Prepaid Expenses 64 Total Current Assets 65 PP&E 66 Total Assets 2018 20,000 18,000 50,000 70,000 12,000 170,000 105,000 275,000 2017 24,000 26,000 78,000 66,000 10,000 204,000 85,000 289,000 130,000 120,000 68 Total Current Liabilities 69 70 Income Statement: 71 Net Sales 72 Cost of Goods Sold I would add two columns to the above info like we did in a previous problem: The change 478,000 318,000 73 74 Compute the following ratios: 75 Current ratio 76 Add-test ratio 77 Inventory turnover 78 Days' sales in inventory 79 Days' sales in receivables 80 Gross profit percentage
Step by Step Solution
There are 3 Steps involved in it

Get step-by-step solutions from verified subject matter experts