

Question: Tools DS ay Use the following data to compute each firm's net profit margin, total asset turnover, equity multiplier, and return on equity. (Note: The
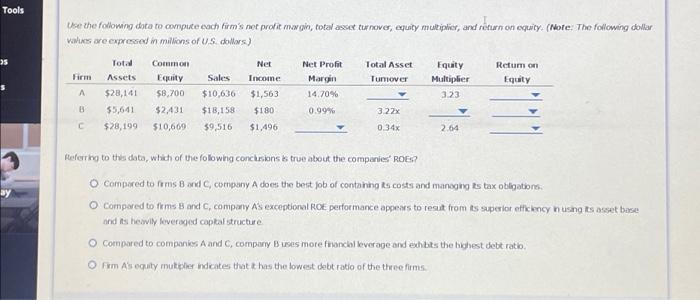
Tools DS ay Use the following data to compute each firm's net profit margin, total asset turnover, equity multiplier, and return on equity. (Note: The following dollar values are expressed in millions of U.S. dollars.) Firm A B C Common Equity $28,141 $8,700 Total Assets Sales $10,636 Net Income $1,563 $5,641 $2,431 $18,158 $180 $28,199 $10,669 $9,516 $1,496 Net Profit Margin 14.70% 0.99% Total Asset Turnover 3.22x 0.34x Referring to this data, which of the following conclusions is true about the companies' ROES? Equity Multiplier 3.23 2.64 Return on Equity O Compared to firms B and C, company A does the best job of containing its costs and managing its tax obligations. Compared to firms B and C, company A's exceptional ROE performance appears to result from its superior efficiency in using its asset base and its heavily leveraged capital structure. O Compared to companies A and C, company B uses more financial leverage and exhibits the highest debt ratio. O Firm A's equity multiplier indicates that it has the lowest debt ratio of the three firms.
Use the following dota to comptite eoch firm's not profit mav gin, total asset turnoves, equity multiplier, and rifurn on equity. (Note; The following dollar valiks are expressed in millions of U.S dollors.) Compored to frms B and C, company A does: the bert fob of containg is costs and manoging Rs tax obligationti. and is hewil leveraged caplat itructure. Cornpared to companies A and C, compary B ises more finonchi leverage and exhbts the bighest debt ratio
Step by Step Solution
There are 3 Steps involved in it
1 Expert Approved Answer
Step: 1 Unlock

Question Has Been Solved by an Expert!
Get step-by-step solutions from verified subject matter experts
Step: 2 Unlock
Step: 3 Unlock