

Question: Top two pictures help solve ... Exam 4 - ANOVA and Regression Excel output (dragged).pdf (1 page) Exam 4 - ANOVA and Regression Excel output.pdf
Top two pictures help solve
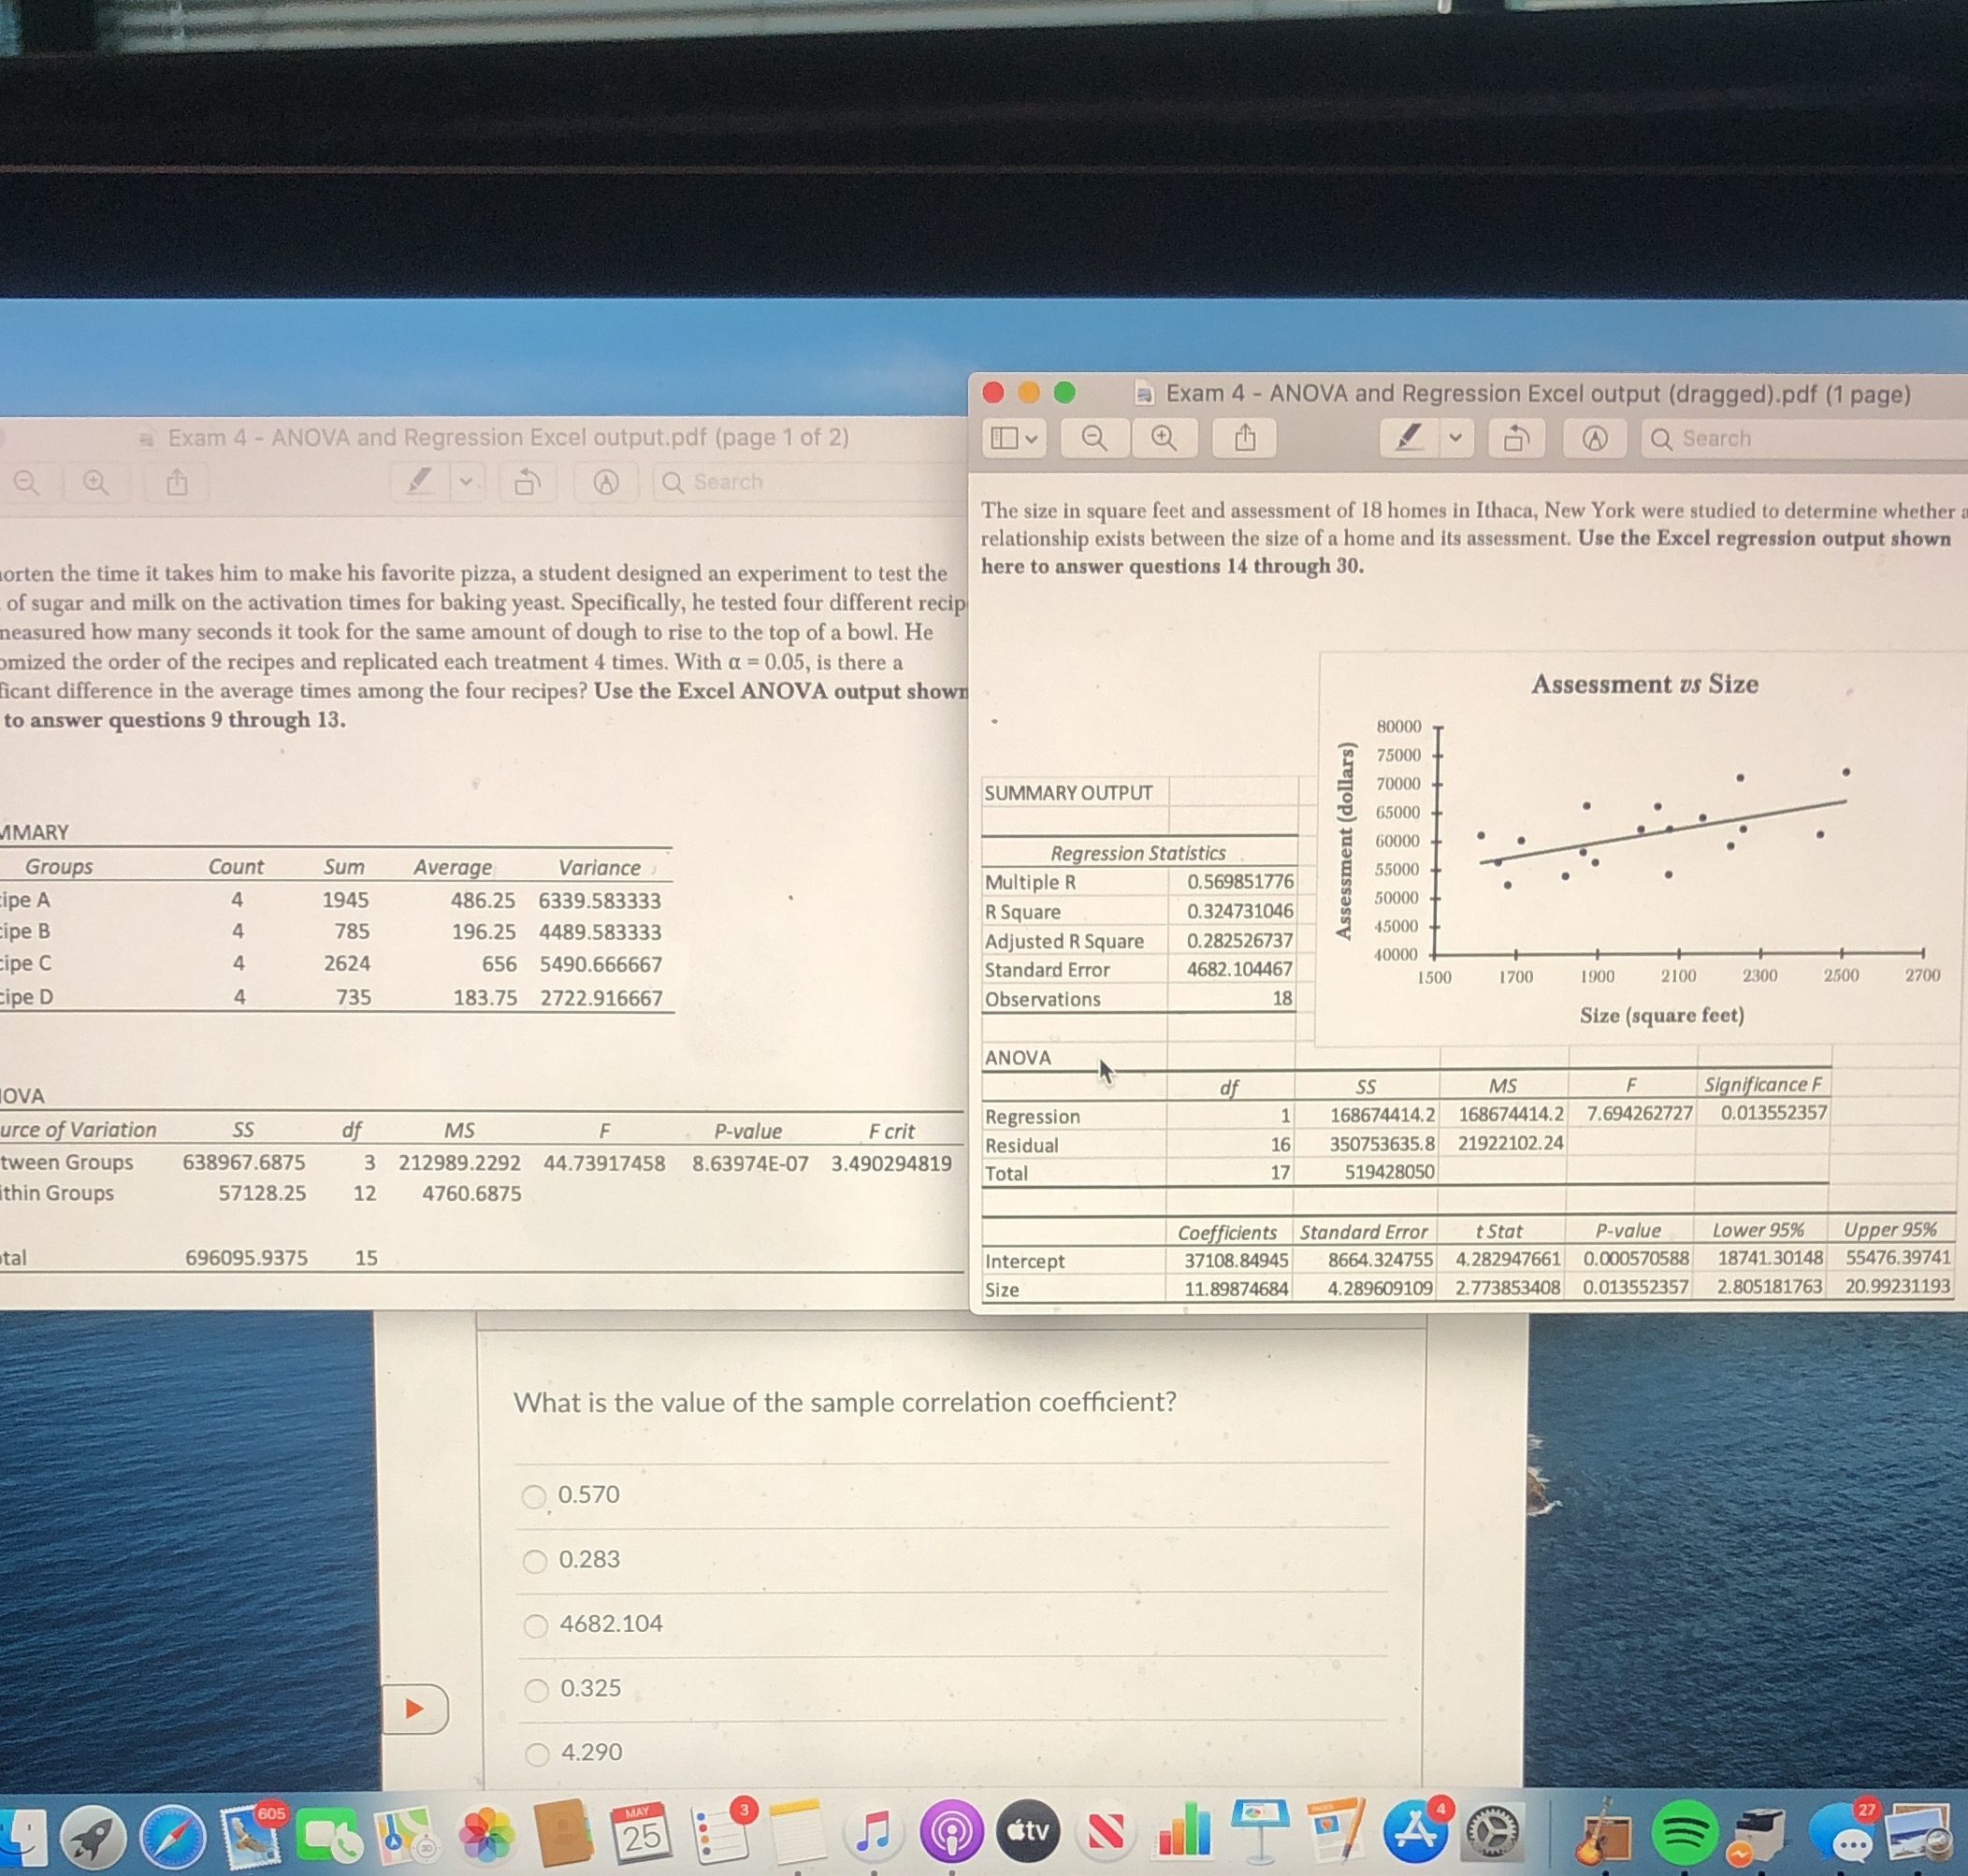
... Exam 4 - ANOVA and Regression Excel output (dragged).pdf (1 page) Exam 4 - ANOVA and Regression Excel output.pdf (page 1 of 2) 1 Q Search Q Search The size in square feet and assessment of 18 homes in Ithaca, New York were studied to determine whether relationship exists between the size of a home and its assessment. Use the Excel regression output shown orten the time it takes him to make his favorite pizza, a student designed an experiment to test the here to answer questions 14 through 30. of sugar and milk on the activation times for baking yeast. Specifically, he tested four different recip easured how many seconds it took for the same amount of dough to rise to the top of a bowl. He omized the order of the recipes and replicated each treatment 4 times. With a = 0.05, is there a icant difference in the average times among the four recipes? Use the Excel ANOVA output shown Assessment us Size to answer questions 9 through 13. 80000 75000 SUMMARY OUTPUT 70000 65000 MMARY 60000 Groups Count Sum Average Variance Regression Statistics 1945 486.25 6339.583333 Multiple R 55000 0.569851776 pe A 4 R Square 0.324731046 50000 Asse pe B 785 196.25 4489.583333 45000 Adjusted R Square 0.282526737 cipe C 2624 656 5490.666667 Standard Error 4682.104467 40000 1500 1700 1900 2100 2300 2500 2700 ipe D 735 183.75 2722.916667 Observations Size (square feet) ANOVA OVA of SS MS Significance F 0.013552357 urce of Variation SS 168674414.2 168674414.2 7.694262727 of MS P-value F crit Regression Residual 16 350753635.8 21922102.24 tween Groups 638967.6875 3 212989.2292 44.73917458 8.63974E-07 3.490294819 Total 519428050 thin Groups 57128.25 12 4760.6875 Coefficients Standard Error t Stat P-value Lower 95% Upper 95% tal 696095.9375 15 Intercept 37108.84945 8664.324755 4.282947661 0.000570588 18741.30148 55476.3974 Size 11.89874684 4.289609109 2.773853408 0.013552357 2.805181763 20.99231193 What is the value of the sample correlation coefficient? 0.570 0.283 4682.104 0.325 4.290 27 25
Step by Step Solution
There are 3 Steps involved in it

Get step-by-step solutions from verified subject matter experts