

Question: Topic 3 Hiw to solve this? Data for the US economy are given in the attached Excel file (USA Data.xlsx). The first column is the
Topic 3 Hiw to solve this?
Data for the US economy are given in the attached Excel file (USA Data.xlsx). The first column is the date (DATE), the second column (GROWTH) gives the rate of economic growth, the third column (RETURNS) contains the returns of the general stock market index, the fourth column (SIR) is short-term interest rates, and the fifth column contains the long-term interest rates (LIR).
(a) Estimate the linear model GROWTHt = B1+ BRETURNSt + B3SIRt + B4LIRt + Ut
with the Excel commands and present the results on a separate sheet (use the REGRESSION option from DATA ANALYSIS). Calculate the correlation coefficient and the coefficient of determination and interpret them. (UNITS 5)
(b) Are each of the estimated coefficients individually statistically significant? Which control do you use, (5 UNITS)
(c) Is the regression overall significant? Which control do you use and why, (5 UNITS)
(d) Consider the hypothesis that interest rates (long-term and short-term) do not affect the rate of economic growth versus the hypothesis that at least one of them does affect the rate of economic growth. (10 UNITS)
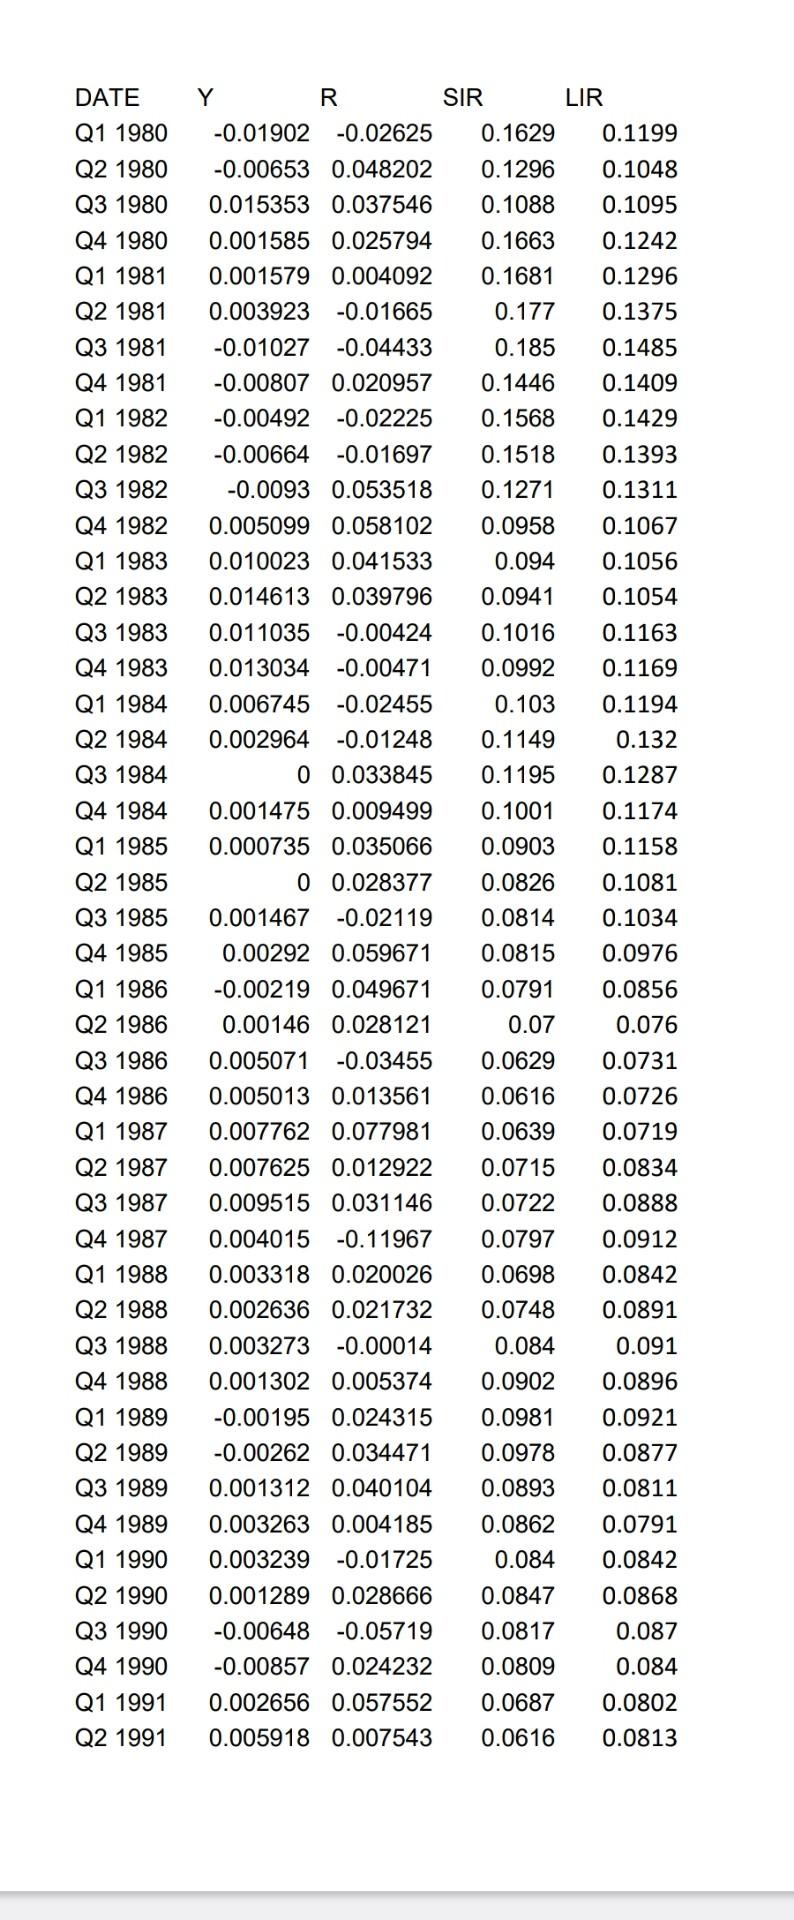
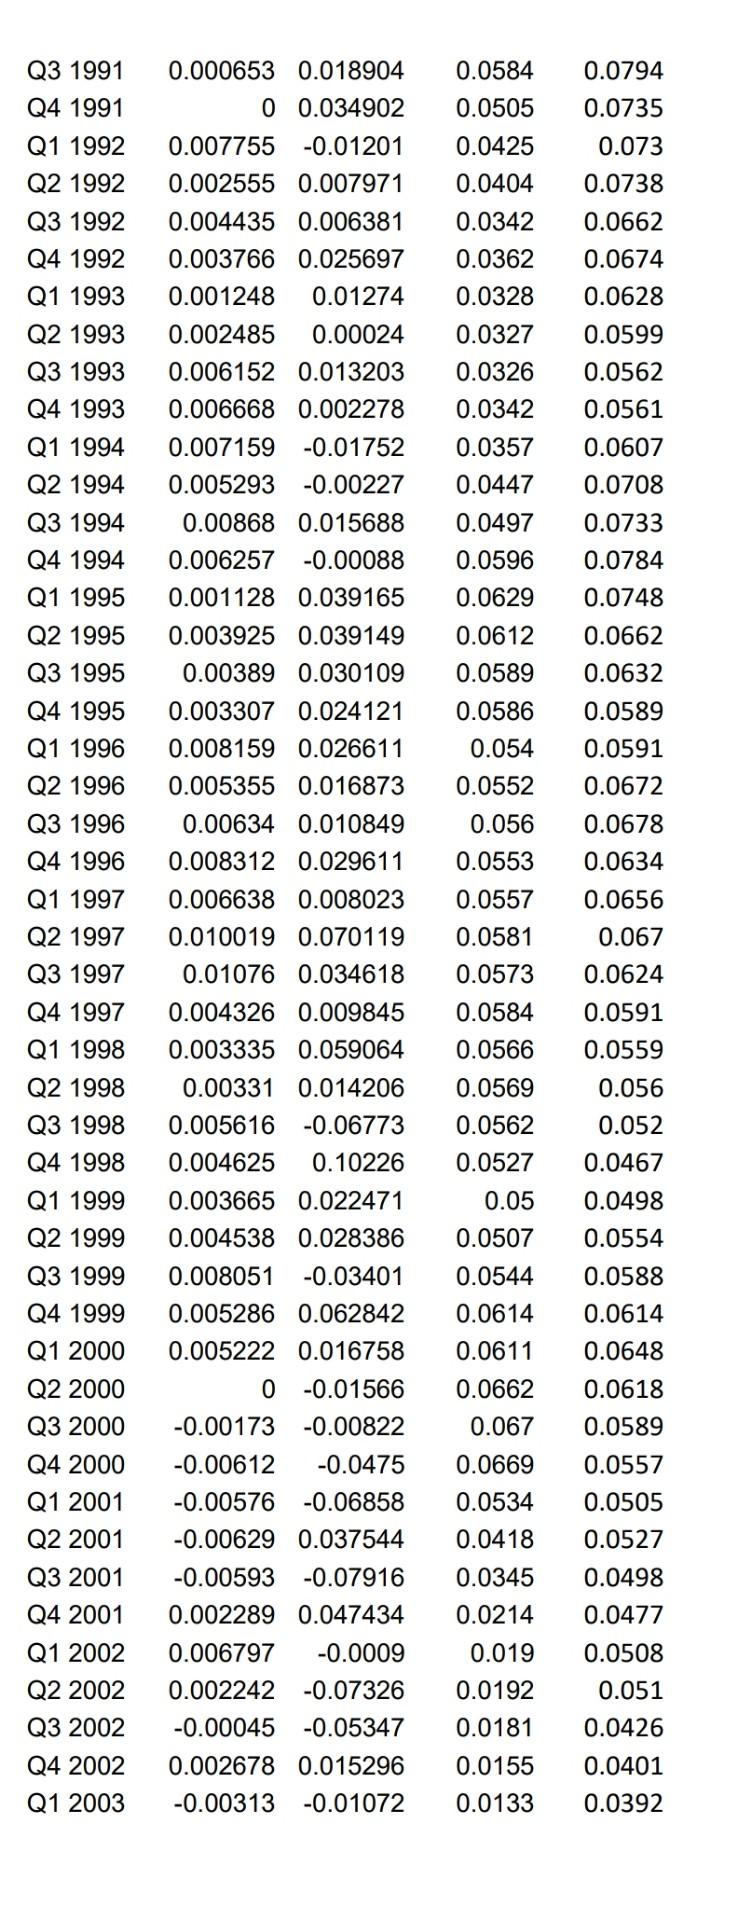
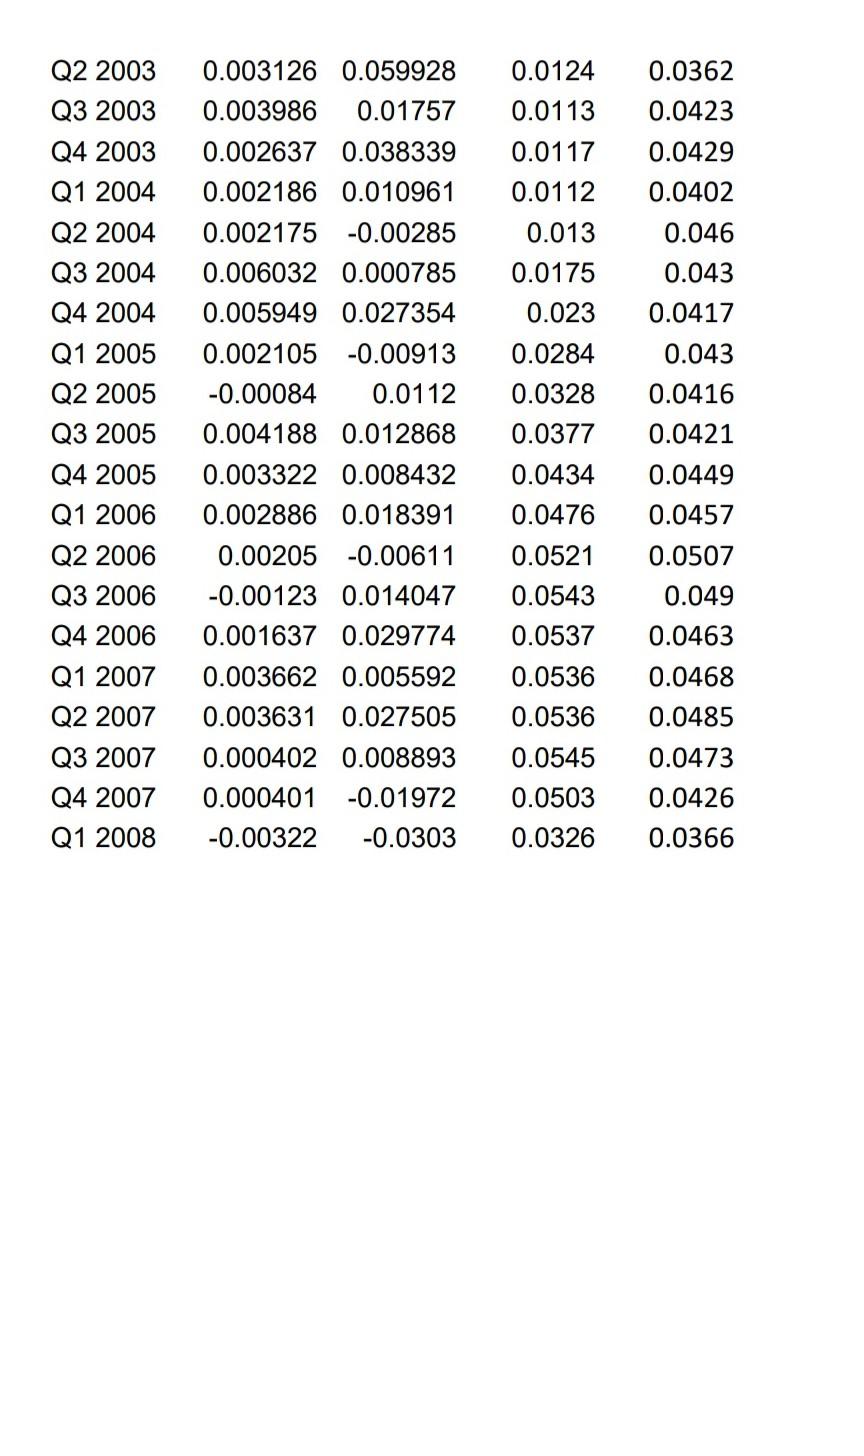
\begin{tabular}{|c|c|c|c|c|} \hline ATE & Y & R & IR & LIR \\ \hline 1980 & 902 & 5 & 9 & 0.119 \\ \hline 1980 & .00653 & 0.048202 & 6 & 10 \\ \hline 31980 & .015353 & 0.037546 & 1088 & 1095 \\ \hline 1980 & .001585 & 0.025794 & 63 & 1242 \\ \hline 81 & 001579 & 0.004092 & 681 & 1296 \\ \hline 21981 & 0.003923 & -0 . & & 0.1375 \\ \hline & & & & 1485 \\ \hline+1981 & 807 & 0.02 & 446 & 1409 \\ \hline 1982 & -0.00492 & -0.0 & & 1429 \\ \hline 1982 & 64 & 97 & & 1393 \\ \hline 31982 & 093 & 18 & & 1311 \\ \hline 1982 & & & & 1067 \\ \hline 11983 & 0.010023 & 0.0 & 094 & 0.1056 \\ \hline 1983 & 0.0 & 0.0 & & 054 \\ \hline 31983 & 35 & & & 163 \\ \hline 1983 & & & & \\ \hline & & & & 1194 \\ \hline 21984 & 64 & & & 0.132 \\ \hline 31984 & 0 & & & 287 \\ \hline 41984 & 175 & 99 & & 1174 \\ \hline 119 & 735 & & & 158 \\ \hline 21985 & 0 & 377 & 26 & 1081 \\ \hline 31985 & 67 & & & 1034 \\ \hline 419 & & & & 976 \\ \hline 198 & 219 & & 91 & 856 \\ \hline 21986 & & & 07 & 076 \\ \hline 31986 & 71 & & & 0731 \\ \hline 419 & & & & 726 \\ \hline 115 & & & & 719 \\ \hline 21987 & 25 & 22 & & 0834 \\ \hline 3198 & & & & 888 \\ \hline 1108 & 15 & 7 & & 912 \\ \hline 8 & & & & 842 \\ \hline 21988 & 36 & 0.0 & & 0891 \\ \hline & & & & .091 \\ \hline & & & & 896 \\ \hline 1108 & 55 & 5 & & 9921 \\ \hline 219 & & & & 0877 \\ \hline Q3 1989 & 12 & 0.0 & & 0811 \\ \hline re & & & & 791 \\ \hline Q1 199 & 39 & -0.0 & & 0.0842 \\ \hline & & & & 0.0868 \\ \hline 2015 & 00648 & -0.05719 & & 0.087 \\ \hline Q4 1990 & & & & 0.084 \\ \hline & & 0.057552 & 0.0687 & 0.0802 \\ \hline & .005918 & 0.007543 & 0.0616 & 0.0813 \\ \hline \end{tabular} \begin{tabular}{|c|c|c|c|c|} \hline 31991 & 0.000653 & 0.018904 & 0.0584 & 0.0794 \\ \hline Q4 1991 & 0 & 0.034902 & 0.0505 & 0.0735 \\ \hline 1992 & 0.007755 & -0.01201 & 0.0425 & 0.073 \\ \hline 21992 & 0.002555 & 0.007971 & 0.0404 & 0.0738 \\ \hline 31992 & 0.004435 & 0.006381 & 0.0342 & 0.0662 \\ \hline 41992 & 0.003766 & 0.025697 & 0.0362 & 0.0674 \\ \hline 11993 & 0.001248 & 0.01274 & 0.0328 & 0.0628 \\ \hline 21993 & 0.002485 & 0.00024 & 0.0327 & 0.0599 \\ \hline 31993 & 0.006152 & 0.013203 & 0.0326 & 0.0562 \\ \hline 41993 & 0.006668 & 0.002278 & 0.0342 & 0.0561 \\ \hline 11994 & 0.007159 & -0.01752 & 0.0357 & 0.0607 \\ \hline 21994 & 0.005293 & -0.00227 & 0.0447 & 0.0708 \\ \hline 31994 & 0.00868 & 0.015688 & 0.0497 & 0.0733 \\ \hline 41994 & 0.006257 & -0.00088 & 0.0596 & 0.0784 \\ \hline 11995 & 0.001128 & 0.039165 & 0.0629 & 0.0748 \\ \hline 21995 & 0.003925 & 0.039149 & 0.0612 & 0.0662 \\ \hline 31995 & 0.00389 & 0.030109 & 0.0589 & 0.0632 \\ \hline 41995 & 0.003307 & 0.024121 & 0.0586 & 0.0589 \\ \hline 11996 & 0.008159 & 0.026611 & 0.054 & 0.0591 \\ \hline 21996 & 0.005355 & 0.016873 & 0.0552 & 0.0672 \\ \hline 31996 & 0.00634 & 0.010849 & 0.056 & 0.0678 \\ \hline 41996 & 0.008312 & 0.029611 & 0.0553 & 0.0634 \\ \hline 11997 & 0.006638 & 0.008023 & 0.0557 & 0.0656 \\ \hline 21997 & 0.010019 & 0.070119 & 0.0581 & 0.067 \\ \hline Q3 1997 & 0.01076 & 0.034618 & 0.0573 & 0.0624 \\ \hline 41997 & 0.004326 & 0.009845 & 0.0584 & 0.0591 \\ \hline 11998 & 0.003335 & 0.059064 & 0.0566 & 0.0559 \\ \hline 21998 & 0.00331 & 0.014206 & 0.0569 & 0.056 \\ \hline Q3 1998 & 0.005616 & -0.06773 & 0.0562 & 0.052 \\ \hline 41998 & 0.004625 & 0.10226 & 0.0527 & 0.0467 \\ \hline 11999 & 0.003665 & 0.022471 & 0.05 & 0.0498 \\ \hline 21999 & 0.004538 & 0.028386 & 0.0507 & 0.0554 \\ \hline Q3 1999 & 0.008051 & -0.03401 & 0.0544 & 0.0588 \\ \hline 41999 & 0.005286 & 0.062842 & 0.0614 & 0.0614 \\ \hline Q1 2000 & 0.005222 & 0.016758 & 0.0611 & 0.0648 \\ \hline 22000 & 0 & -0.01566 & 0.0662 & 0.0618 \\ \hline Q3 2000 & -0.00173 & -0.00822 & 0.067 & 0.0589 \\ \hline 42000 & -0.00612 & -0.0475 & 0.0669 & 0.0557 \\ \hline Q1 2001 & -0.00576 & -0.06858 & 0.0534 & 0.0505 \\ \hline Q2 2001 & -0.00629 & 0.037544 & 0.0418 & 0.0527 \\ \hline Q3 2001 & -0.00593 & -0.07916 & 0.0345 & 0.0498 \\ \hline Q4 2001 & 0.002289 & 0.047434 & 0.0214 & 0.0477 \\ \hline Q1 2002 & 0.006797 & -0.0009 & 0.019 & 0.0508 \\ \hline Q2 2002 & 0.002242 & -0.07326 & 0.0192 & 0.051 \\ \hline Q3 2002 & -0.00045 & -0.05347 & 0.0181 & 0.0426 \\ \hline+2002 & 0.002678 & 0.015296 & 0.0155 & 0.0401 \\ \hline Q1 2003 & -0.00313 & -0.01072 & 0.0133 & 0.0392 \\ \hline \end{tabular} \begin{tabular}{lrrrr} Q2 2003 & 0.003126 & 0.059928 & 0.0124 & 0.0362 \\ Q3 2003 & 0.003986 & 0.01757 & 0.0113 & 0.0423 \\ Q4 2003 & 0.002637 & 0.038339 & 0.0117 & 0.0429 \\ Q1 2004 & 0.002186 & 0.010961 & 0.0112 & 0.0402 \\ Q2 2004 & 0.002175 & -0.00285 & 0.013 & 0.046 \\ Q3 2004 & 0.006032 & 0.000785 & 0.0175 & 0.043 \\ Q4 2004 & 0.005949 & 0.027354 & 0.023 & 0.0417 \\ Q1 2005 & 0.002105 & -0.00913 & 0.0284 & 0.043 \\ Q2 2005 & -0.00084 & 0.0112 & 0.0328 & 0.0416 \\ Q3 2005 & 0.004188 & 0.012868 & 0.0377 & 0.0421 \\ Q4 2005 & 0.003322 & 0.008432 & 0.0434 & 0.0449 \\ Q1 2006 & 0.002886 & 0.018391 & 0.0476 & 0.0457 \\ Q2 2006 & 0.00205 & -0.00611 & 0.0521 & 0.0507 \\ Q3 2006 & -0.00123 & 0.014047 & 0.0543 & 0.049 \\ Q4 2006 & 0.001637 & 0.029774 & 0.0537 & 0.0463 \\ Q1 2007 & 0.003662 & 0.005592 & 0.0536 & 0.0468 \\ Q2 2007 & 0.003631 & 0.027505 & 0.0536 & 0.0485 \\ Q3 2007 & 0.000402 & 0.008893 & 0.0545 & 0.0473 \\ Q4 2007 & 0.000401 & -0.01972 & 0.0503 & 0.0426 \\ Q1 2008 & -0.00322 & -0.0303 & 0.0326 & 0.0366 \end{tabular}
Step by Step Solution
There are 3 Steps involved in it

Get step-by-step solutions from verified subject matter experts