

Question: Topic: Data Analysis (R language) ////////////////////////////////////////////// Q. Consider a dataset which contains three variables, Age (in months), Height (in cm), Number_of_Siblings. Two different linear regression
Topic: Data Analysis (R language)
//////////////////////////////////////////////
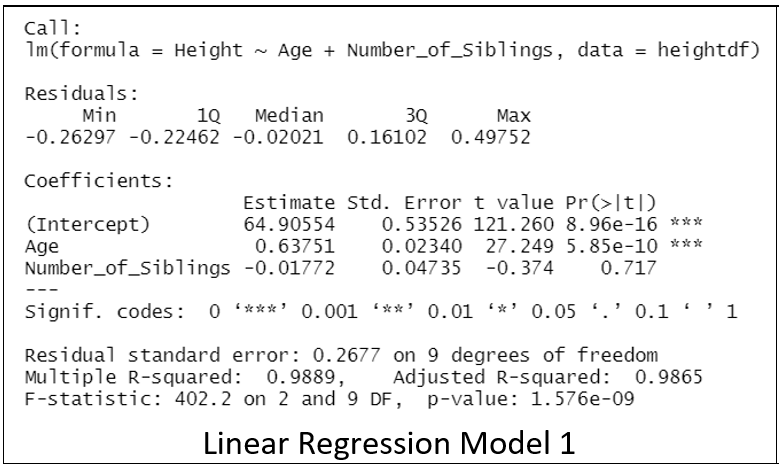
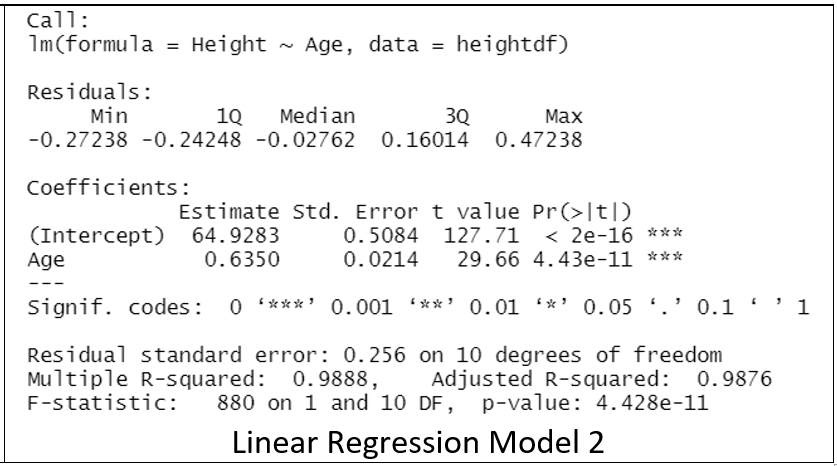
Q. Consider a dataset which contains three variables, Age (in months), Height (in cm), Number_of_Siblings. Two different linear regression models have been developed using R and the following figures shows the output of the linear regression models.
1. Both Linear Regression Model 1 and Linear Regression Model 2 have more than one input variables.
( True / False )
2. Both Linear Regression Model 1 and Linear Regression Model 2 have one output variable, which is the Intercept.
( True / False )
3. Adjusted R-squared is a better performance measure when the model has more than one variables.
( True / False )
4. In R, the lm() method can be utilized to build a linear regression model.
( True / False )
5. If there is a child who is 2.2 years old, the Linear Regression Model 2 predicts on average that the height in cm is around 81.69.
( True / False )
Call: Im(formula = Height Age + Number_of_Siblings, data = heightdf) = Residuals: Min 10 Median -0.26297 -0.22462 -0.02021 30 Max 0.16102 0.49752 Coefficients: Estimate Std. Error t value Pr>It (Intercept) 64.90554 0.53526 121.260 8.96e-16 *** Age 0.63751 0.02340 27.249 5.85e-10 *** Number_of_Siblings -0.01772 0.04735 -0.374 0.717 Signif. codes: 0***' 0.001 **' 0.01 '*' 0.05 '.'0.1''1 Residual standard error: 0.2677 on 9 degrees of freedom Multiple R-squared: 0.9889, Adjusted R-squared: 0.9865 F-statistic: 402.2 on 2 and 9 DF, p-value: 1.576e-09 Linear Regression Model 1 Call: Im(formula = = Height Age, data = , = heightdf) Residuals: Min 10 Median 30 Max -0.27238 -0.24248 -0.02762 0.16014 0.47238 Coefficients: Estimate Std. Error t value Pr>t] (Intercept) 64.9283 0.5084 127.71
Step by Step Solution
There are 3 Steps involved in it

Get step-by-step solutions from verified subject matter experts