

Question: Topic: Normal Distribution Show solution and I provide the key answer below. Normal Distribution Activity: A total of 82 Grade 11 students of ABC Senior
Topic: Normal Distribution
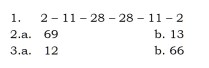
Show solution and I provide the key answer below.
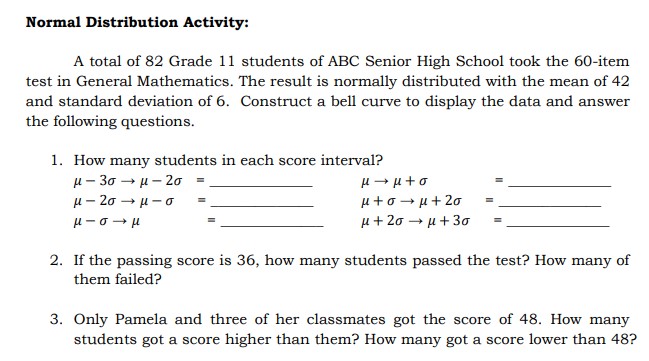
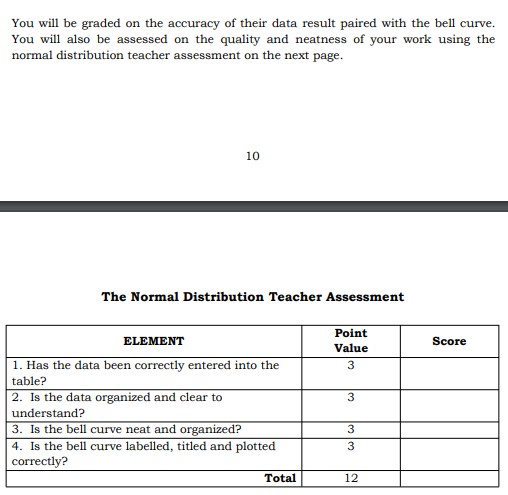
Normal Distribution Activity: A total of 82 Grade 11 students of ABC Senior High School took the 60-item test in General Mathematics. The result is normally distributed with the mean of 42 and standard deviation of 6. Construct a bell curve to display the data and answer the following questions. 1. How many students in each score interval? H - 30 - 1 -20 H - 20 - 1-0 Hto- u+ 20 H- 0- U H + 20 - u+ 30 2. If the passing score is 36, how many students passed the test? How many of them failed? 3. Only Pamela and three of her classmates got the score of 48. How many students got a score higher than them? How many got a score lower than 48?You will be graded on the accuracy of their data result paired with the bell curve. You will also be assessed on the quality and neatness of your work using the normal distribution teacher assessment on the next page. 10 The Normal Distribution Teacher Assessment Point ELEMENT Score Value 1. Has the data been correctly entered into the 3 table? 2. Is the data organized and clear to 3 understand? 3. Is the bell curve neat and organized? 3 4. Is the bell curve labelled, titled and plotted 3 correctly? Total 12
Step by Step Solution
There are 3 Steps involved in it

Get step-by-step solutions from verified subject matter experts